Looking Ahead – More Than Words

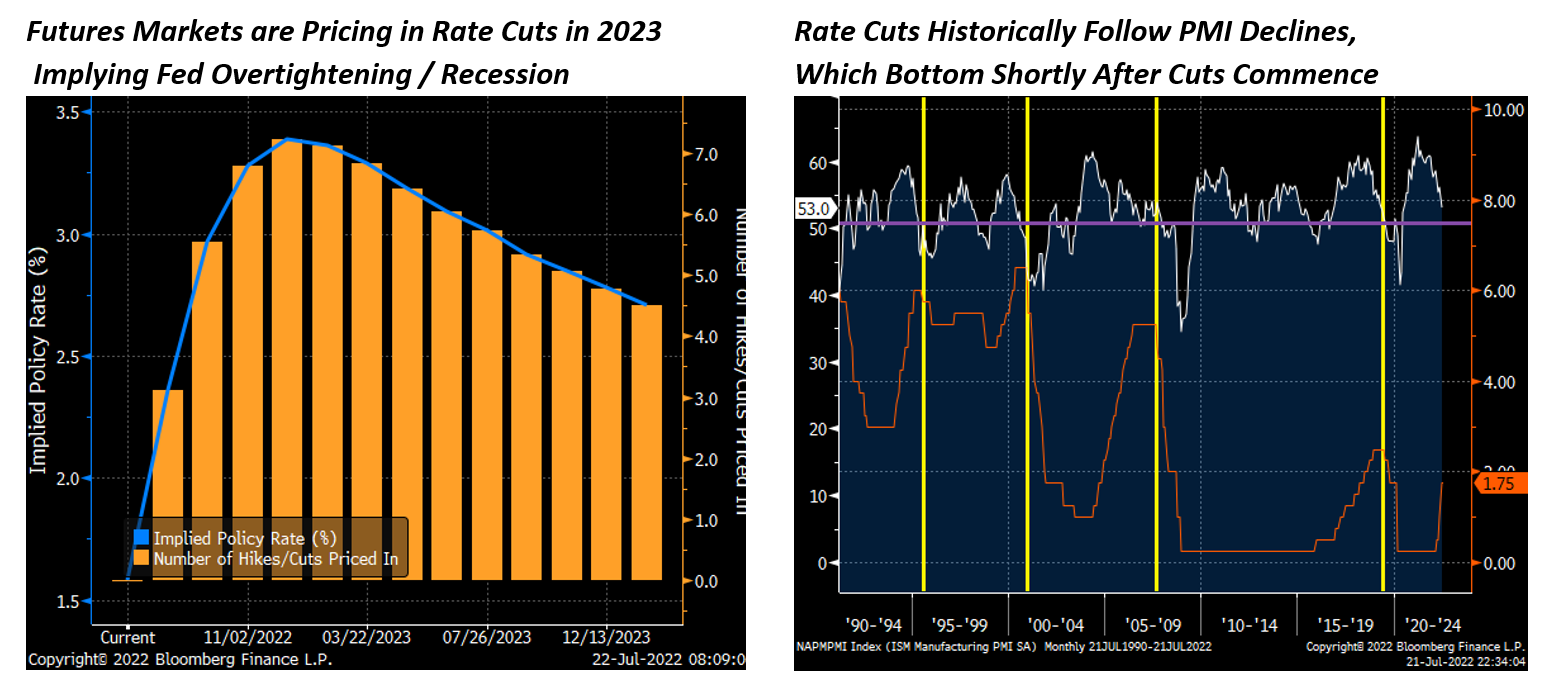
January’s blowout US nonfarm numbers roiled Treasury markets and halted the 2023 stock market rally in its tracks, and although markets steadied in the middle of this week, traders began to look to next week’s US Consumer Price and Produce Price Index prints with genuine concern. Last month’s jobs data might well be an anomaly, but upside surprises from those key inflation readings, alongside the possibility that retail sales and industrial production data also top estimates, could cause a paradigm shift in the expectations for Fed policy. Following the jobs report, investors marked up the terminal rate of the hiking cycle from roughly 5.00% at the March meeting to 5.25% at the May FOCM decision, but expectations for rate cuts in the back half of the year persisted through midweek. Yesterday, however, traders began to meaningfully reexamine that longstanding assumption of late 2023 Fed easing.


In short, the constant refrain from Fed officials about higher-for-longer interest rates, which is our base case, has not convinced investors, but recent data has begun to change their minds. For the near term, we expect next week’s data to be reassuring to investors, with inflation continuing to moderate and growth indicators muted, but our longstanding view is that the eventual repricing of markets to align with the higher-for-longer interest rate reality will be a challenging period for risk assets and will mark the second half of the bear market that began in early 2022.


A few notes on the observed dynamics in rates markets over the past day:

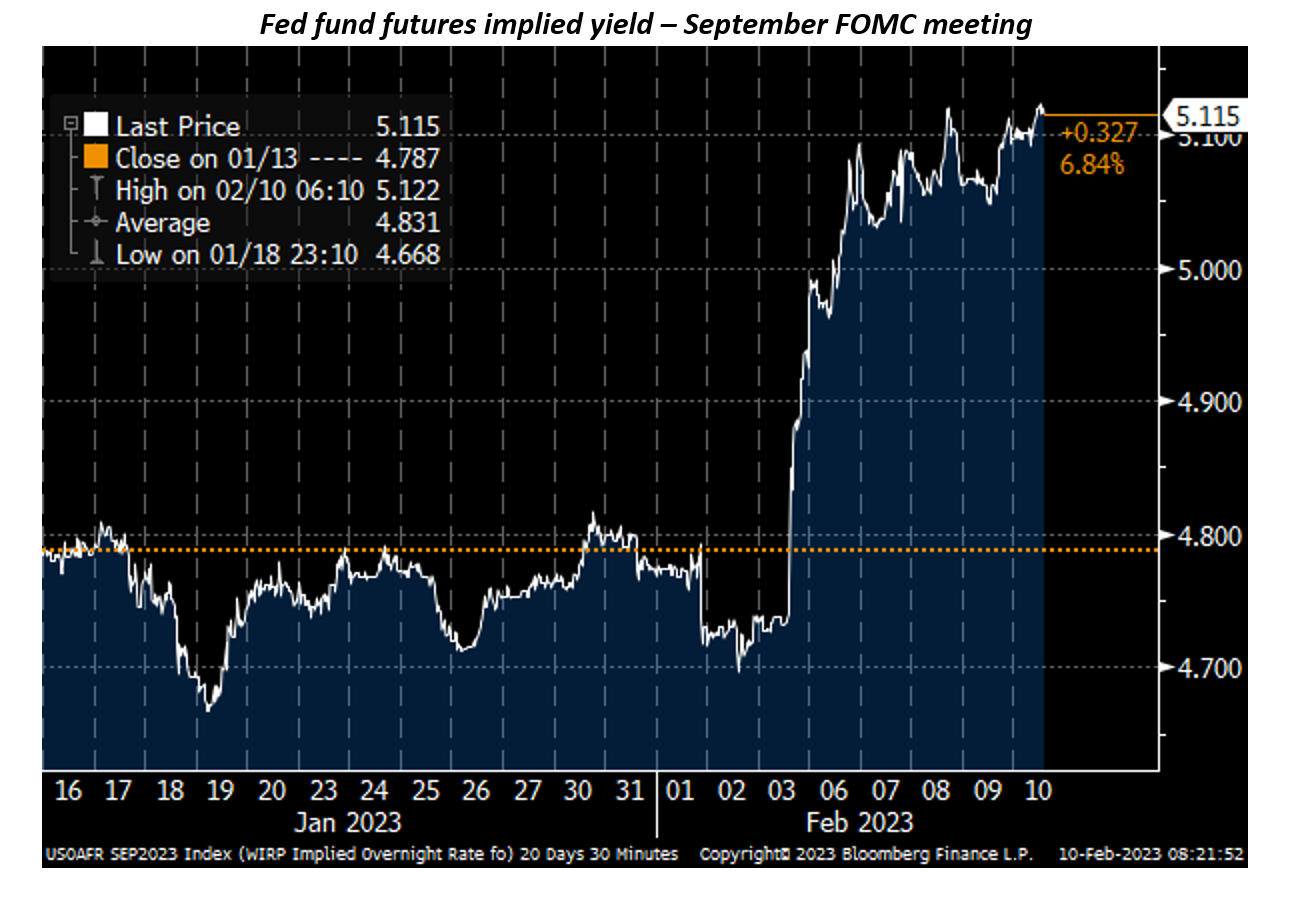
  • The nonfarm payroll number accomplished what volumes of Fedspeak have failed to achieve – convincing markets that peak rates of this cycle are most likely to be above 5%. As the chart below of the fed fund futures September implied rates shows, Chair Powell’s commentary at the February 1st Fed decision actually put expected rates lower, and only the nonfarm payroll print on February 3rd elicited a meaningful reaction.


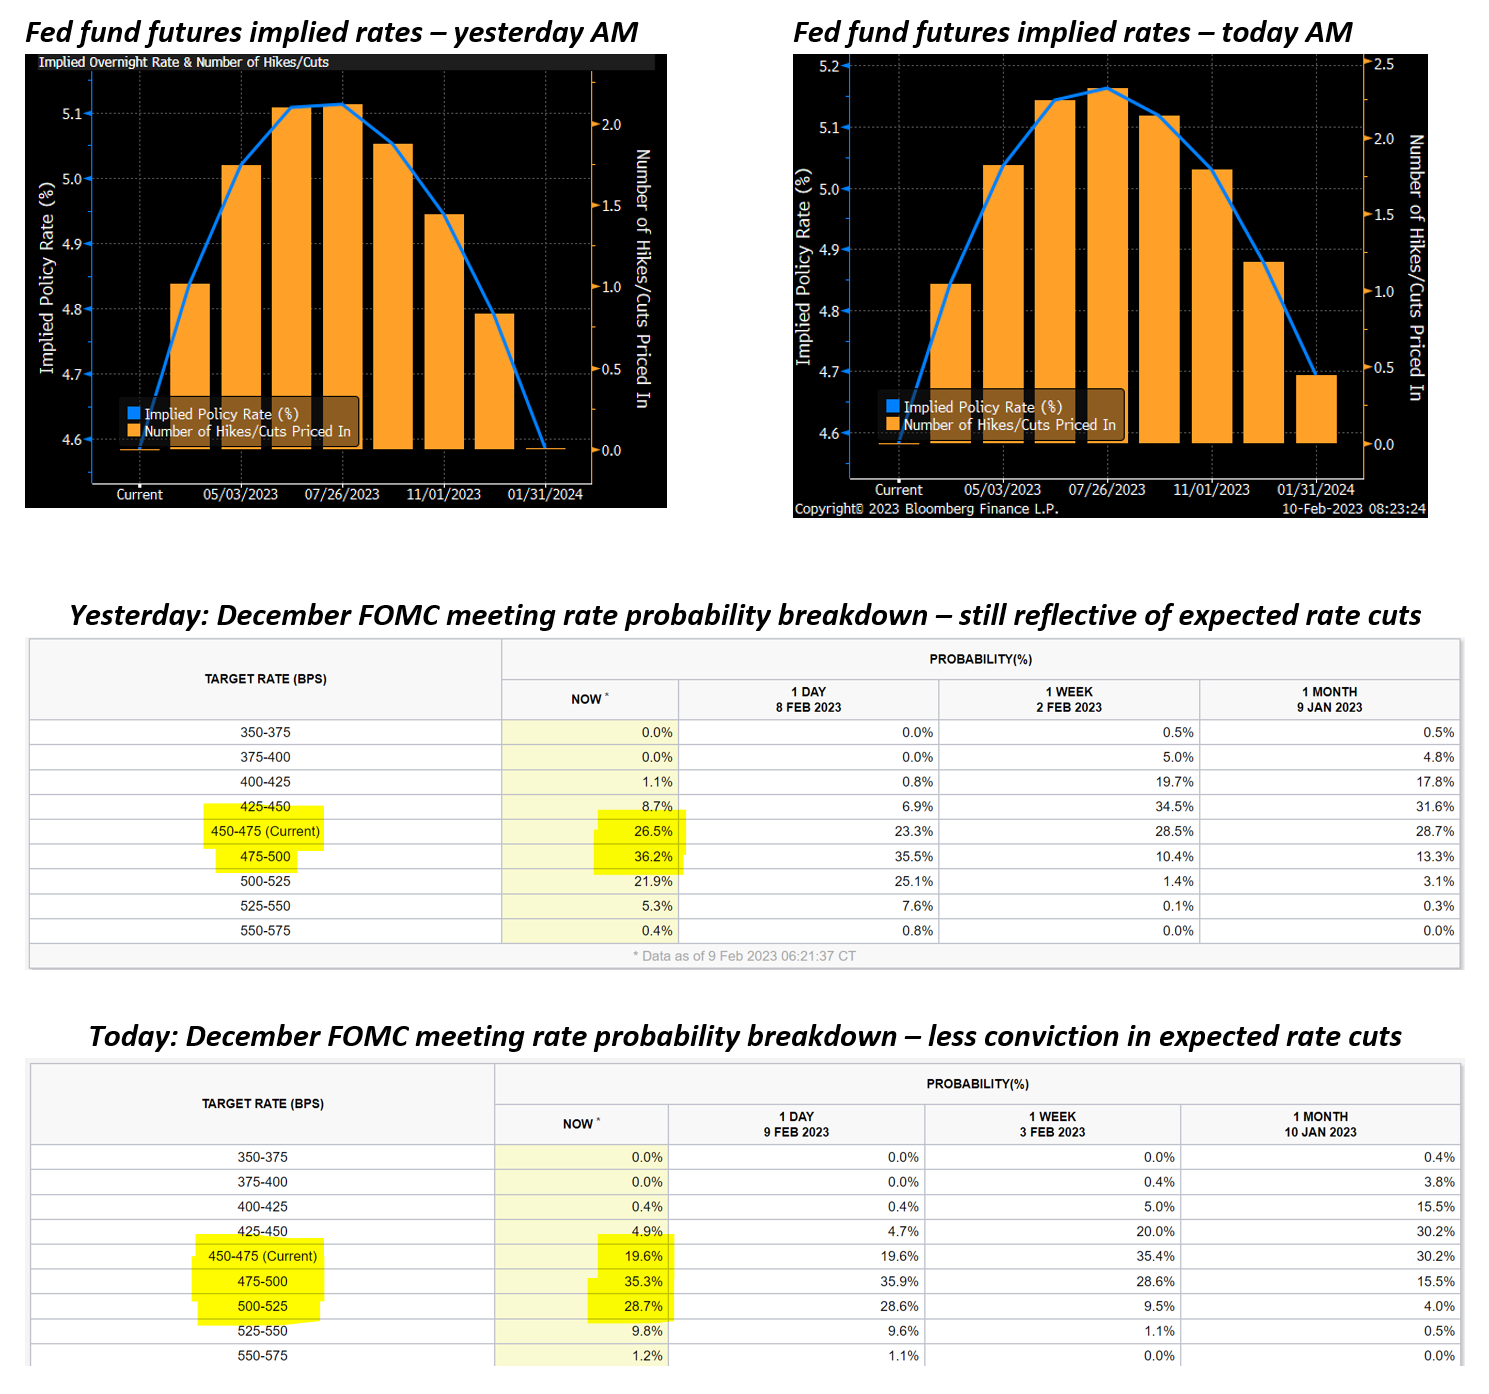
  • Initially, price action suggested that the January jobs number told us more about the Fed’s near-term reaction function than about how the economy will play out and how policy will need to evolve later this year. As of yesterday morning, Fed fund futures showed the two more rate hikes that were being priced in before the summer being taken back by January next year, presumably in the face of deteriorating US growth or a recession. In short, January’s jobs numbers were being taken as a headfake that the Fed falls for, only to have to unwind the tightening within months.

But yesterday, fed fund futures began to pretty dramatically reprice the outlook for Fed easing, as next week’s inflation figures and retail sales data loom.


Looking ahead, next week’s macro calendar centers around the highly-anticipated US Consumer Price Index figures for January, with the Producer Price Index also due. US retail sales and industrial production data for last month will be scrutinized for any signs of additional slowing. UK inflation and retail sales are also on the calendar, along with EU industrial production, Australian business and consumer confidence, and Japan GDP. Peak earnings season is now considered over, but next week still features some reports from industry bellwethers including Coca-Cola, Deere, Shake Shack, Shopify, and Zillow.


  • US Inflation Data (CPI & PPI)
  • US Retail Sales
  • US Industrial Production
  • UK Inflation & Retail Sales
  • EU Industrial Production
  • Corporate Earnings
  • Japan GDP
  • Australian Confidence Gauges

Global Economic Calendar: Super Bowl of economic data


Monday


The Westpac-Melbourne Institute Index of Consumer Sentiment for Australia increased 5% to 84.3 in January, rising for the second straight month and posting the largest monthly gain since April 2021. January was the first month since April last year not to oversee a spike in the RBA cash rate. Still, Westpac expects the Reserve Bank Board to continue its interest rate policy tightening at the next meeting on February 7. The Index has lifted a cumulative of 8.1% over the last two months, from a 78 read in November which might prove to be the lowest point for Consumer Sentiment in this cycle, though sentiment remains depressingly low. The improvement in January was mainly driven by sub-indexes for “economic conditions next 12mths” (10.2%), “family finances next 12mths” (6.6%), and “time to buy a dwelling” (4.4%). Expectations about the labor market also brightened, while expectations for house prices dropped 10.3%.


Australia’s NAB business confidence index rose 3 points to -1 in December 2022 but stayed in the negative territory for the second month and remained below its long-run average. Sentiment strengthened across most industries, except transport & utilities. Meanwhile, business conditions weakened, dropping for the third month (12 vs 20 in November) amid falls in sales (18 vs 27), profitability (12 vs 19), and employment (8 vs 13). The decline was broad-based, with all sectors moderating. Leading indicators suggested conditions might ease further, with forward orders edging down (3 vs 5) and capacity utilization relaxing above average at 83.7%. Price and cost growth slowed but remained elevated. “Momentum is clearly slowing though activity remains solid,” said NAB chief economist Alan Oster. “We know the full impact of rates is yet to fully flow through so the survey should give us an indication of the accelerating impact from rates over coming months.”


The Japanese economy shrank 0.2% quarter-on-quarter in the three months to September 2022, compared with flash data of a 0.3% fall and after a 1.1% growth in the previous period. The latest figure came amid an upward revision of both government spending (0.1% vs flat reading in the first estimate and after a 0.7% rise in Q2) and net trade with exports growing faster than initially anticipated (2.1% vs 1.9% in the flash figure and after a 1.5% previously). Meantime, private consumption was sluggish (0.1% vs 0.3% in the initial print and after a 1.7% rise in Q2), hit by another COVID wave in August and despite efforts from the government to step up support for households. Business investment growth slowed notably (1.5%, matching the preliminary print and after a 2.4% gain in Q2).


Tuesday


The unemployment rate in the UK was unchanged at 3.7% in the three months to November of 2022, the same as in the previous period and in line with expectations. The number of people unemployed for up to six months increased, driven by those aged 16 to 24 years. Those unemployed for over six and up to 12 months increased, while those unemployed for over 12 months decreased. The employment rate was estimated at 75.6%, largely unchanged, with the number of employees and part-time self-employed workers increasing while full-time self-employed workers decreased. Meanwhile, the number of job vacancies fell by 75K to 1.161 million, as uncertainty across industries leads to holding back on recruitment.


Annual CPI inflation rate in the US slowed for a sixth straight month to 6.5% in December of 2022, the lowest since October of 2021, in line with market forecasts. It follows a 7.1% reading in November. Energy cost increased 7.3%, well below 13.1% in November, as gasoline cost dropped 1.5%, following a 10.1% surge in November. Also, fuel oil cost slowed (41.5% vs 65.7%) while electricity prices rose slightly faster (14.3% vs 13.7%). A slowdown was also seen in food prices (10.4% vs 10.6%) while cost of used cars and trucks continued to decline (-8.8% vs -3.3%). On the other hand, the cost of shelter increased faster (7.5% vs 7.1%). Compared to the previous month, the CPI edged 0.1% lower, the first decline since May of 2020, and beating forecasts of a flat reading. Inflation seems to have peaked at 9.1% in June of 2022 but it still remains more than three times above the Fed’s 2% target. Additionally, core CPI, which exclude volatile items such as food and energy, went up by 5.7 percent from a year earlier, compared to a 6.0 percent rise in the prior month and mostly in line with market expectations.


Building permits in the US fell 1.0 percent from a month earlier to a seasonally adjusted annual rate of 1.337 million in December 2022, the lowest level since May 2020, as high inflation and rising mortgage rates hit demand for new housing, revised data showed. Single-family authorizations declined 6.4 percent to a rate of 731 thousand, the lowest since April 2020, while the volatile multi-segment rose 6.3 percent to 606 thousand. Permits were down in the South (-1.7 percent to 740 thousand), Midwest (-12.1 percent to 175 thousand) and Northeast (-2.5 percent to 115 thousand), but were up in the West (9.3 percent to 307 thousand).


Wednesday


Annual inflation rate in the UK fell to 10.5% in December of 2022 from 10.7% in November, matching market forecasts. It marks a second consecutive month of slowing inflation and the lowest rate in three months, after a peak of 11.1% in October. The largest downward contribution came from transport prices (6.5% vs 7.2%), namely motor fuels. Average petrol prices fell by 8.3 pence per litre between November and December. Prices also eased for clothing and footwear (6.5% vs 7.5%) and recreation and culture (4.9% vs 5.3%), mainly games, toys and hobbies. On the other hand, prices rose faster for restaurants and hotels (11.3%, the largest since 1991 vs 10.2%), particularly accommodation, and food and non-alcoholic beverages (16.8%, which is the highest since 1977 according to modelled estimates vs 16.4%). Compared to the previous month, the CPI increased 0.4%, the same as in November and also in line with forecasts.


Retail sales in the US declined 1.1% month-over-month in December 2022, following an upwardly revised 1% drop in November and worse than forecasts of a 0.8% fall. Sales at gasoline stations recorded the biggest decrease (-4.6%), followed by furniture stores (-2.5%), motor vehicle dealers (-1.2%), electronics and appliances stores (-1.1%), miscellaneous (-1.1%) and nonstore retailers (-1.1%). In contrast, sales were up 0.3% in building materials and garden equipment stores (0.3%) and sporting goods, musical instruments and book sellers (0.1%). Sales at food and beverage stores were flat. Retail sales aren’t adjusted for inflation and part of the decrease in December can be explained by a fall in goods prices during the month and a holiday shopping that was pulled forward into October. However, excluding sales at gasoline stations, sales were down 0.8%, in another sign of a weaker-than-expected holiday shopping and a slowdown in consumer spending amid high inflation and interest rates.


Industrial production in the US fell by 0.7% mom in December of 2022, following an upwardly revised 0.6% decrease in November and more than market expectations of a 0.1% loss. It was the biggest drop in industrial activity since September 2021, as higher interest rates and prices weighed on demand. Manufacturing output dropped 1.3%, way more than expectations for a 0.3% decrease. The indexes for durable and nondurable manufacturing dropped 1.1% and 1.5%, respectively, while the index for other manufacturing (publishing and logging) stepped down 0.9%. Meanwhile, mining was down 0.9% while utilities rose 3.9%, driven by increases for both electric and natural gas utilities. Capacity utilization dropped 0.6 percentage point in December to 78.8%, a rate that is 0.8 percentage point below its long-run (1972–2021) average. Considering Q4, industrial production declined 1.7%.


Japan’s trade deficit widened to JPY 1,448.5 billion in December 2022 from JPY 603.1 billion in the same month a year earlier and compared with market consensus of a gap of JPY 1,652.8 billion. This was the 17th straight month of a trade shortfall, the longest stretch since 2015, raising concerns over the strength of the country’s economic recovery. Imports climbed 20.6% yoy to JPY 10,235.7 billion, the 20th straight month of double-digit rise; while exports grew at a softer 11.5%, the 22nd straight month of growth but the softest pace since the start of the year, to JPY 8,787.3 billion. Considering the whole year, Japan posted a trade deficit of JPY 19,971.3 billion, the second straight annual shortfall and the biggest since 1979, driven by a surge in imports amid high commodity prices and the slump in yen.


Thursday


The Producer Price Index in the US dropped 0.5 percent from a month earlier in December 2022, following a revised 0.2 percent gain in November and compared with market expectations of a 0.1 percent fall. It was the largest monthly decline since April 2020, adding to signs that inflationary pressure in the world’s largest economy is cooling. Goods prices were down 1.6 percent, led by a 7.9 percent slump in energy cost and, to a lesser extent, a 1.2 percent fall in food prices. On the other hand, service prices edged 0.1 percent higher, due to increased margins for final-demand trade services. On an unadjusted yearly basis, the PPI increased 6.2 percent in December, the least since March 2021.


Friday


Retail sales in the UK sank 1% month-over-month in December of 2022, following an upwardly revised 0.5% drop in November and compared to market forecasts of a 0.5% rise. Sales at non-food stores fell 2.1% as consumers are cutting back on spending because of increased prices and affordability concerns. Sales were mostly down for cosmetics, sports equipment, games and toys and watches and jeweller and at department and clothing stores. Also, food sales edged 0.3% lower as customers stocked up early for Christmas. Compared with December 2021, sales declined by 5.8%, the most for that month since records began. Retail sales are now 1.7% below their pre-covid levels. Between 2021 and 2022, retail sales volumes fell by 3.0%, as rising prices and the cost of living affected sales volumes.


Prices for US imports rose 0.4 percent from a month earlier in December 2022, following a revised 0.7 percent decrease in the previous month and compared with market consensus of a 0.9 percent fall. It was the first monthly increase in import prices since June on the back of higher nonfuel and fuel prices. Prices for nonfuel imports increased 0.4 percent, the first one-month advance since April, due to rising costs for nonfuel industrial supplies and materials; consumer goods; foods, feeds, and beverages; capital goods; and automotive vehicles. Import fuel prices moved up 0.6 percent, the first monthly increase since June, as higher natural gas prices more than offset lower prices for petroleum. On a yearly basis, US import prices advanced 3.5 percent in December, accelerating from November’s 2.7 percent increase.


US export prices fell by 2.6 percent from a month earlier in December of 2022, above expectations of a 0.5 percent drop and following an upwardly revised 0.4 percent retreat in the prior month. It was the sixth consecutive monthly decrease in export prices as nonagricultural export prices fell 2.7 percent, the most since in July 2022 and agricultural export prices decreased 2.4 percent . On a yearly basis, prices for US exports rose by 5 percent, the least since January of 2021 and slowing from the downwardly revised 6.1 percent in the previous month.

Looking Ahead – ’23 and Me

Looking Ahead – ‘23 and Me

As we noted last week, our base case for topping inflation and slowing (but not crashing) growth with a downshifting Fed is the recipe for the second half 2022 rally. This week’s tantalizing bounce has us temped to upgrade stocks earlier than we feel comfortable doing – financial markets have a way of forcing investors into uncomfortable decisions, of course. Still, we are holding our neutral posture for now on US stocks, especially with some banana peels possible amid next week’s gauntlet of mega IT earnings, plus a pivotal Fed decision, but upcoming dips will look increasingly buyable for the more extended second half rally we anticipate.

If this is an ordinary market cycle, then we would probably further assume that the bottom of this bear market is nearly in place after a few more months of pain. And this is essentially what futures markets are suggesting, with the hiking cycle seen topping at year end 2022 and interest rate cuts commencing gradually in spring/summer of 2023 (see the chart on the left below). This would follow the historical pattern of sliding growth (with manufacturing PMI as the growth proxy in the chart at right below) eliciting rate cuts which, shortly thereafter, help lift growth from its lows. Stocks anticipate this and would start to rally later this year as the Fed puts its last rate hike on the board.

However, our view is that inflation will come down but stay sticky, with the housing component remaining elevated and persistently lofty energy prices keeping the Fed on alert for a rebound in price pressures lest they ease prematurely. With economists and commentators like Larry Summers breathing down their necks, and the narrative about the high costs of the “stop/start” 70’s monetary policy approach shaping their reaction function, plus the standard “once bitten, twice shy” dynamic, we expect that the bar for rate cuts in 2023 will be very high. Also, on the political front, the Democrats will also be blaming midterm outcomes on inflation and will be favorably inclined to the Fed prioritizing inflation suppression over growth support, which is not a negligible factor in our view.

We think this formulation will make for a challenging 2023 for risk assets, as the assumption of rate cuts and easing evaporate despite continued or worsening weakness in growth. It is worth noting that Fed tightening does hit the economy with a lag and we expect the headwinds from persistently high energy prices to exert durable and non-linear pressure on consumers. In short, the consensus view is things get worse before they get better, while we expect things to get better in the second half of 2022 and relapse.

Looking ahead, the main event on next week’s macro calendar is the July Fed meeting, with analysts expecting a 75bps hike after speculators toyed with the idea of 100bps after the hotter than expected June Consumer Price Index reading earlier this month. On the data front, the initial reading of Q2 US GDP will be in focus as economists project a modest expansion. EU GDP readings are also due, along with inflation figures for the bloc, while Japan also releases its CPI data along with retail sales and industrial production. Earnings reporting season heats up with a heavy concentration of mega-cap IT companies reporting figures, including Google, Microsoft, Apple, Amazon, and Facebook. Also reporting are 3M, Visa, UPS, Chipotle, Coca-Cola, Ford, GE, GM, Hilton, Mastercard, Pfizer, and Procter & Gamble.

  • Fed Meeting
  • US GDP
  • EU GDP
  • Corporate Earnings
  • EU CPI
  • Japan CPI, Retail & Industrial Production


Global Economic Calendar: Fed Dead Ahead

 Monday

The Ifo Business Climate indicator for Germany fell to 92.3 in June from a 3-month high of 93 in May, falling short of market expectations of 92.9 as concerns over the threat of gas shortages caused the subindexes for both current conditions (99.3 vs 99.6 in May) and expectations (85.8 vs 86.9) to deteriorate. By sector, sentiment weakened in manufacturing, chemicals, and especially trade, which saw its expectations index fall to its lowest level since April 2020. Wholesalers and retailers also expressed pessimism about the second half of the year. On the upside, the service and construction sectors notched improvements in both their assessments of the current business situation as well as their expectations for the coming months, although many companies remain tangibly pessimistic.

The Chicago Fed National Activity Index dropped to an eight-month low of +0.01 in May from +0.40 in April, with production-related indicators contributing -0.01 (down from 0.29 in April) and the personal consumption and housing category falling to -0.11 from +0.10 in the previous month. By contrast, employment-related indicators contributed +0.08, up slightly from +0.07, and the contribution of the sales, orders, and inventories category jumped to +0.05 in May from -0.07. The index’s three-month moving average, CFNAI-MA3, decreased to +0.27 from +0.39, suggesting that the economy is still expanding, albeit at a slower rate compared to previous months.

 Tuesday

The S&P CoreLogic Case-Shiller 20-city home price index in the US increased 21.2% year-over-year in April, a new record high, above market forecasts of 21% and following a downwardly revised 21.1% increase in March. Figures showed once again that the housing market remained strong heading into Q2, with Tampa (35.8%), Miami (33.3%), and Phoenix (31.3%) remaining the cities with the strongest price gains in the last year. However, the national index eased to 20.4% from 20.6% in March. “April 2022 showed initial (although inconsistent) signs of a deceleration in the growth rate of U.S. home prices. We continue to observe very broad strength in the housing market and a more-challenging macroeconomic environment may not support extraordinary home price growth for much longer,” said Craig J. Lazzara, Managing Director at S&P DJI.

New home sales in the US rose 10.7% from a month earlier to a seasonally adjusted annual rate of 696,000 in May, beating market expectations of 588,000. Increases were seen in home sales in the West (39.3% to 202,000) and South (12.8% to 413,000), while sales continued to decline in the Northeast (-51.1% to 23,000) and Midwest (-18.3% to 58,000). Meanwhile, the median sales price of new houses sold was $449,000, down slightly from the previous month but still much higher than $390,400 a year earlier, while the average sales price was $511,400, down from $569,500 in April.

The annual inflation rate in Australia surged to 5.1% in Q1 2022 from 3.5% in Q4, topping market estimates of 4.6% and marking the strongest quarterly inflation since the introduction of the Goods and Services Tax in July 2000 as soaring fuel prices and building costs boosted the overall rate. Main upward pressure came from transport prices, which rose the most since the Iraqi invasion of Kuwait in 1990 (13.7% vs 12.% in Q4); while price increases in food and non-alcoholic beverages (4.3% vs 1.9%), alcohol and tobacco (1.8% vs 1.1%), housing (6.7% vs 4%), recreation (3% vs 2.1%), health (3.5% vs 3.3%), and insurance and financial services (2.7% vs 2.2%) also accelerated. On a quarterly basis, consumer prices went up 2.1%, the most since Q3 2000 and following a 1.3% gain in Q4, mainly due to a jump in the cost of new dwellings and fuel. The RBA Trimmed Mean CPI went up 3.7% y/y, the most in 12 years, exceeding the midpoint of the central bank’s 2-3% target for the second consecutive quarter. Quarter-on-quarter, the index increased 1.4% following a 1% rise in Q4.

Wednesday

The GfK Consumer Climate Indicator in Germany sank to a record low of -27.4 heading into July from an upwardly revised -26.2 in June, slightly above market forecasts of -27.7. All of the main subindexes weakened as high inflation and recession fears weighed heavily on consumers, with economic expectations falling to -11.7 from -9.3, income expectations dropping to a near-20-year low of -33.5 from -23.7, and the propensity to buy sinking to -13.7 from -11.1. “The ongoing war in Ukraine and disrupted supply chains are causing energy and food prices in particular to explode and making the consumer climate more gloomy than ever,” said Rolf Bürkl, GfK consumer expert.

US Durable Goods Orders increased 0.7% month-over-month to $267.2 billion in May, following a 0.4% rise in April and beating forecasts of a 0.1% rise, in a sign that business spending plans remained strong despite higher interest rates and elevated inflation. Orders increased for transportation equipment (0.8%), capital goods (0.8%), machinery (1.1%), and computers and electronics (0.5%), while orders for non-defense capital goods excluding aircraft, a closely watched proxy for business spending plans, edged up 0.5%, up from 0.3% in April.

Pending home sales in the US unexpectedly rose 0.7% month-over-month in May, the first rise in seven months and following a 4% decline in April. Figures came well above market forecasts of a 3.7% fall. By region, signings increased in the Northeast (15.4%) and South (0.2%), while the Midwest (-1.7%) and West (-5%) experienced declines. However, despite the gain in May, soaring mortgage rates and low supply were expected to continue to weigh on the housing market, with the NAR estimating that at the median single-family home price and with a 10% down payment, monthly mortgage payments have increased by about $800 since the start of the year as mortgage rates have climbed 2.5% since January. “Despite the small gain in pending sales from the prior month, the housing market is clearly undergoing a transition. Contract signings are down sizably from a year ago because of much higher mortgage rates,” said Lawrence Yun, Chief Economist at the National Association of Realtors. Year-on-year, pending home sales plunged 13.6%.

The Federal Reserve’s Open Market Committee will convene next Tuesday, where it is expected to once again raise interest rates by 75 bps as inflation continues to rage, although some are forecasting an even more aggressive 100 bps hike after June CPI data showed prices increased 9.1% year-on-year, the highest reading since November 1981. At its last meeting in June, the Committee raised the target for the federal funds rate by 75 bps to 1.5%-1.75%, marking the third consecutive rate increase and the largest hike since 1994. Fed Chair Jerome Powell has stated that the Fed remains committed to doing whatever it takes to restore price stability, although other Fed policymakers including Atlanta Fed President Raphael Bostic and St. Louis Fed President James Bullard have downplayed or, in the case of Bostic, outright cautioned against a dramatic 100 bps hike. The Fed is currently projected to bring the federal funds rate to around 3.5% by year’s end.

 Thursday

The annual inflation rate in Germany was confirmed at 7.6% in June, slowing from 7.9% in the previous month, which was the highest reading since the German reunification in 1990, as a controversial fuel price rebate designed to cushion the impact of the conflict in Ukraine on consumers had a slight downward effect on overall inflation. Energy prices rose at a softer 38% year-over-year, compared to 38.3% in May, while food price inflation accelerated to 12.7%, the highest rate since at least 1992 and up from 11.1% in May. The price of energy products increased sharply, especially for heating oil (108.5%), motor fuels (33.2%), and natural gas (60.7%), reflecting the impact of Russia’s invasion of Ukraine. Meanwhile, inflation in the cost of services eased to 2.1% from 2.9%, with rent prices up 1.7%. On a monthly basis, consumer prices rose 0.1%, the least in seven months and down from 0.9% growth in May. The CPI, harmonized to compare with other European countries, was up 8.2% on the year but edged down 0.1% month-on-month, which was the first decline since November 2020.

The US economy (GDP) contracted an annualized 1.6% on quarter in the first three months of 2022, slightly worse than the previous estimate of a 1.5% decline and marking the first quarterly contraction since the onset of the pandemic in 2020 as record trade deficits, supply constraints, worker shortages, and high inflation weighed on growth. Imports surged more than anticipated (18.9% vs 18.3% in the second estimate), led by nonfood and nonautomotive consumer goods, while exports dropped less than previously estimated (-4.8% vs -5.4%). Also, consumer spending growth was revised lower (1.8% vs 3.1%) as increased spending on services, especially housing and utilities, was partially offset by decreased spending on goods, namely groceries and gasoline. In addition, private inventories subtracted 0.35 percentage points from growth, much less than the 1.09 percentage point drag reported in the second estimate. Fixed investment growth remained robust (7.4%), although housing investment was subdued (0.4%).

Japan’s unemployment rate rose to 2.6% in May from 2.5% in April, slightly above market expectations of 2.5%. The number of unemployed increased by 40,000 to 1.8 million, while employment decreased by 140,000 to 69.04 million and those detached from the labor force fell by 40,000 to 41.13 million. The non-seasonally adjusted labor force participation rate edged up to 62.7% from 62.5% in May 2021. Meanwhile, the jobs-to-applications ratio reached a 25-month high of 1.24 in May from 1.23 in April, in line with forecasts.

Friday

The consumer confidence index in Japan fell to an 18-month low of 32.1 in June from 34.1 in the previous month amid ongoing global uncertainty. All subindexes weakened, with employment perceptions down 1.6 points from a month earlier to 37.4, overall livelihood down 2.6 points to 29.8, views toward income growth down 1.4 points to 35.8), and willingness to buy durable goods down 2.6 points to 25.3.

The German economy (GDP) expanded by 0.2% on quarter in the first three months of 2022, recovering from a 0.3% fall in Q4 2021 and in line with preliminary estimates. Growth was mainly supported by a rebound in capital formation (2.7% vs 0% in Q4) as construction investment bounced back and machinery and equipment investment increased, while government spending rose 0.1% (vs 0.2% in Q4). Household expenditure was down 0.1%, an improvement from the 1.3% contraction in Q4, while net exports also had a downward effect on the economy as exports fell 2.1% (vs a 3.8% rise) and imports continued to rise, albeit at a slower pace than in the previous quarter (0.9% vs 4.1%). On a yearly basis, the economy grew 3.8%, which was the fastest yearly growth in three quarters.

The Eurozone economy (GDP) expanded 0.6% on quarter in the first three months of 2022, up from previous estimates of 0.3% and above a downwardly revised 0.2% gain in Q4 2021 as net trade and inventories helped boost overall output. Exports rose 0.4% compared to a 0.6% decline in imports, while gross fixed capital formation rose just 0.1%. Meanwhile, household consumption sank 0.7% and public expenditure contracted 0.3%. Compared with the same period last year, the Eurozone economy advanced 5.4%. Still, the economy was expected to face headwinds from the war in Ukraine and related supply disruptions and uncertainty. The European Central Bank (ECB) also ended an eight-year period of negative interest rates yesterday, which is likely to drag consumer spending and investment in the coming months.

The annual inflation rate in the Eurozone was confirmed at a record high of 8.6% in June, compared to 8.1% in May and 1.9% a year earlier. Prices increased across the board, with energy once again making the largest contribution (42% vs 39.1% in May) and food, alcohol & tobacco (8.9% vs 7.5%), services (3.4% vs 3.5%), and non-energy industrial goods (4.3% vs 4.2%) also showing sustained inflation. Excluding energy, the inflation rate increased to 4.9% from 4.6% in the previous month, well above the ECB’s target of 2%. Month-over-month, prices increased 0.8%.

Personal spending in the US increased 0.2% month-over-month in May, the weakest gain so far this year and following a downwardly revised 0.6% rise in April. Figures fell short of market forecasts of 0.4%. Still, spending rose for international travel and hospital services, gasoline, and services, namely housing, although spending on motor vehicles and parts, especially new autos, declined. Adjusted for changes in prices, purchases of goods and services fell 0.4%, marking the first drop this year as high inflation weighs on affordability.

Personal income in the US went up 0.5% from a month earlier in May, the same as in the previous month and matching market expectations as an increase in compensation and proprietors’ income offset a decrease in government social benefits. Within compensation, the increase reflected increases in both private and government wages and salaries. The increase in proprietors’ income was led by nonfarm income, while the fall in government social benefits reflected a decrease in transfers to nonprofit healthcare providers through the Provider Relief Fund, although the decrease was partially offset by increases in Medicaid and Medicare payments.

The personal consumption expenditure price index increased 0.6% month-over-month in May, up from a 0.2% rise in April. Still, the annual rate remained at 6.3% after reaching a record high of 6.6% in March. Energy prices increased 35.8%, up from 30.4% in April, although food inflation quickened once again to 11% from 10%. Core PCE, which excludes food and energy, rose 4.7% from one year ago, easing from 4.9% in April and below forecasts of 4.8%.


Looking Ahead – Halftime Huddle

Looking Ahead – Halftime Huddle


“Worst first half of a year since 1970 for US stocks” is the headline grabber stat from Q1-2 2022, as investors and analysts alike grapple with what is shaping up to be a punishing conclusion to the ultra-accommodative monetary policy era in the face of multi-decade highs in inflation with scant relief in sight. Our view is that this is still going to be a year of two halves, as slowing growth and meaningful recession risk, alongside signs of a developing downtrend in price pressure metrics, facilitate a downshift in the Fed’s pace of monetary tightening.


For now, though, we are sitting tight with the neutral positioning in equities, rates, and currencies we adopted in mid-May as we wait for this sloppy/choppy early summer transition period to pass ahead of some clearing for the second half of this year.


Supporting our call for a more balanced macro picture in the second half of the year are the declines in US gasoline prices, global metals prices, the CRB Raw Industrials basket, used car prices, freight and shipping rates, etc. which we think in aggregate track a broad rollover in price pressures (please see last week’s Looking Ahead – Summer Squalls for a set of these charts). TIPS breakevens, the key market-based gauge of inflation expectations, are tracking this narrative.


Even if inflation is in the process of moderating, however, this is not yet clear from the data, which has been like a Rorschach Test. Core PCE Prices were relatively encouraging but the Consumer Price Index (CPI) and Producer Price Index (PPI) were the opposite of reassuring, while increasing evidence of slowing growth in PMIs and Fed activity surveys, alongside dismal business and consumer confidence surveys, is being balanced to some degree but still robust labor market indicators. And without a clear trend, the headline risk associated with each discrete US inflation data release is so high that building long positions in anticipation of a better 2H2022 is still quite problematic – as was shown by the steep losses that followed the dispiriting upside surprise in May CPI, which may end up being an outlier in an overall deceleration.


We expect that trends will be clearer by the July meeting, where a 50 basis point (bps) hike, which is our base case, would look like a dovish surprise. If this is accompanied by more measured Fed rhetoric on inflation fighting and a more balanced stance, anticipation of similar restraint in September and beyond should help stabilize global risk assets after the drubbing they took in the first half.


What would change our minds? Top 5

1.     US inflation and growth fail to slow in tandem into the second half of the year

2.     Growth and inflation pressures do wane, but the Fed declines to downshift their tightening trajectory despite growing evidence of a slowdown and narrowing inflationary pressures, driving the economy into the ground (this is currently the base case reflected in financial markets)

3.     Oil prices break higher out of their current trading range and march to record highs, all but ensuring global stagflation irrespective of central bank policy adjustments

4.     Growth and inflation moderates, the Fed downshifts its pace of tightening, but the damage is already done to the economy and activity contracts much faster than expected before the Fed is able to contemplate cuts

5.     Black swan event – candidates include EU debt crisis redux, the disorderly implosion of Tether, the collapse of the Bank of Japan’s Yield Curve Control policy, failure of a major hedge fund, and a significant escalation in the Russia/Ukraine or other global flashpoint.


What is likely to follow a 2H2022 rebound? Coaches will always tell their teams not to look out to the next game, and while that’s sound advice for athletes, investors don’t have that luxury. Futures markets are pricing in Fed rate cuts in 2023, which is at odds with our base case, as it would take a sharply disinflationary episode (recession) to induce the Fed to take such a step even in the face of what is still expected to be above 2% target inflation. In short, we think markets are likely to get better for a time before likely relapsing in 2023 whereas the market seems to be suggesting more near-term pain followed by an easing of conditions in 2023.


Looking ahead, next week’s holiday-shortened macro calendar in the US features the nonfarm payroll report for June, which is expected to remain robust despite percolating fears of an impending recession, while the June Fed and ECB Meeting Minutes will also be in the spotlight. The Reserve Bank of Australia has a decision, and G-20 foreign ministers are meeting in Bali, Indonesia. Other notable data includes additional global PMI readings and EU retail sales, industrial production, and wholesale prices.

·    US Nonfarm Payrolls

·    Fed Meeting Minutes

·    ECB Meeting Minutes

·    Global PMIs

·    EU Retail Sales

·    EU Industrial Production

·    EU Wholesale Prices

·    Australia Central Bank

MPP Holiday Publication Schedule – There will be no Market Viewpoints or Five Minute Macro on Sunday and Monday, respectively, due to the holiday weekend in the US – normal publications will resume on Tuesday. Here’s wishing all our US subscribers a very happy 4th of July weekend!


Global Economic Calendar: Summer jobs


Monday


The German trade surplus fell sharply to €1.3 billion in April from €9.7 in the previous month, marking its lowest level since 1992 as imports jumped 25.2% year-on-year to €120.9 billion compared to a much smaller 9.2% increase in exports to €122.2 billion. On a seasonally adjusted basis, German exports rose 4.4% compared with March as shipments to the EU and US rose 4.2% and 7.7%, respectively, although exports to Russia fell another 10% after falling 62.3% in March due to sanctions imposed. Meanwhile, imports increased 3.1% from the previous month boosted by purchases from China (up 12.3% from March) the UK (up 5.6%), and the Eurozone (2.4%), while imports fell from the US (-1.2%) and Russia (-16.4%).


The annual inflation rate in Turkey increased for the 12th consecutive month to 73.5% in May, the highest since October 1998 and up from 69.97% in April and a much lower 16.6% in May 2021. Figures came below market forecasts of 76.6% but remained extremely elevated as the lira continued its plummet and as real interest rates remained largely negative. Upward price pressures were recorded across sectors, including food and non-alcoholic beverages (91.6% vs 89.1% in April); housing and utilities (63.5% vs 61.1%); furnishings and household equipment (82.1% vs 77.6%); hotels, cafes, and restaurants (76.8% vs 69.3%); and transportation (107.6% vs 105.9%), which was fueled by surging prices for energy (121.1% vs 118.2%). On a monthly basis, prices rose 3% from April.


The Caixin China Manufacturing PMI increased to 48.1 in May from April’s 26-month low of 46.0, marginally beating market forecasts of 48.0 but marking the third straight month of declining factory activity amid continued COVID-zero restrictions. Both output and new orders fell amid further declines in export orders and employment – albeit at a softer pace than the previous month. Meanwhile, backlogs of work and delivery times continued to increase due to COVID-related disruptions and travel curbs, prompting firms to cut purchases in order to cut down on inventory. Looking forward, business sentiment fell for the fifth consecutive month as managers remained wary of the continued impact of COVID restrictions and the war in Ukraine.


Tuesday


The Reserve Bank of Australia increased interest rates by 50 bps at its policy meeting in June in its first back-to-back rate hike in 12 years, bringing the cash rate up to 0.85% as the board said its prior position of huge monetary support is no longer appropriate given the strength of the economy and elevated inflationary pressures. The central bank also said labor markets have remained strong as employment numbers continued to make gains and the jobless rate fell to its lowest in nearly 50 years. “The Board expects to take further steps in the process of normalizing monetary conditions in Australia over the months ahead,” RBA Governor Philip Lowe said in a statement.


US factory orders rose 0.2% month-over-month to $533.2 billion in April following a downwardly revised 1.8% gain in March, falling short of market expectations of a 0.7% gain. Orders slowed for durable goods (0.5% vs 0.7% in March), namely for primary metals (0.8% vs 3.3%) and computers and electronic products (0.1% vs 1.8%), while those for fabricated metal products (-0.1% vs 1.2%) and electrical equipment, appliances, and components (-0.2% vs 2.6%) declined. Still, orders accelerated for machinery (1% vs 0.6%) and transport equipment (0.7% vs -0.3%). Among nondurable goods, orders slowed to 0.2% from 0.9% in the previous month.


Wednesday


The ISM Manufacturing PMI for the US unexpectedly rose to 56.1 in May from 55.4 in April, beating market forecasts of 54.5 as new orders (55.1 vs 53.5 in April), production (54.2 vs 53.6), and inventories (55.9 vs 51.6) all posted faster increases. In addition, price pressures decreased for the second consecutive month, falling to 82.2 from 84.6. Meanwhile, employment contracted to 49.6 from 50.9, although firms reported improved progress on addressing moderate-term labor shortages at all levels of the supply chain. Business sentiment remained robust regarding demand, although managers reported continued concern over supply chains and pricing issues.


The Jobs and Labor Turnover Survey (JOLTS) showed the number of job openings in the United States was 11.400 million in April, down from a revised record 11.855 million in March. Figures came in line with market expectations. Job openings decreased in several industries, with the largest declines in healthcare and social assistance (-266,000), retail trade (-162,000), and accommodation and food services (-113,000). Job openings increased in transportation, warehousing, and utilities (+97,000); nondurable goods manufacturing (+67,000); and durable goods manufacturing (+53,000). Meanwhile, the so-called quits rate was unchanged at 2.9% as some 4.4 million Americans quit their jobs.


Minutes of June’s FOMC Meeting will provide more clarity on the Fed’s decision to hike interest rates by 75 bps. Chair Powell said at a European Central Bank conference that the US economy is in “strong shape,” and the central bank can reduce inflation to its target of 2% while maintaining a solid labor market. “We will not allow a transition from a low inflation environment to a high inflation environment,” he said. Nonetheless, policymakers are cautious of acting too aggressively. In testimony to the Senate banking committee last Wednesday, Powell acknowledged that steep interest rate hikes may cause a recession and that avoiding it mostly depends on factors outside of the Fed’s control. “The other risk, though, is that we would not manage to restore price stability and that we would allow this high inflation to get entrenched in the economy,” Powell added. “We can’t fail on that task. We have to get back to 2% inflation.”


Australia’s trade surplus widened to AUD 10.50 billion in April from an upwardly revised AUD 9.74 billion in March, beating market forecasts of a AUD 9.3 billion surplus. It was the largest trade surplus since January, as exports grew by 1% from a month earlier to a new record high of AUD 50.38 billion, while imports dropped 0.7% to AUD 39.88 billion. For the first four months of the year, the trade surplus increased to AUD 40.80 billion from AUD 34.48 billion in the same period last year.


Thursday


Canada’s trade surplus narrowed to CAD 1.5 billion in April from a downwardly revised CAD 2.3 billion in the previous month, falling well short of market expectations of CAD 2.9 billion as imports rose by 1.9% to a record high of CAD 62.8 billion compared to a slower 0.6% rise in exports to CAD 64.3 billion, also a record high. The rise in imports was fueled by increased purchases of clothing, footwear, and accessories (24.2%); metal and non-metallic mineral products (10.5%); and energy products (5%), with natural gas and refined petroleum product purchases rising 57% and 52.6%, respectively, to offset a 20.9% reduction in crude oil imports. On the export side, shipments were lifted by sales of consumer goods (5%) and motor vehicles and parts (3.9%), although energy exports fell 0.9%.


The Ivey Purchasing Managers Index in Canada rose to 72 in May from 66.3 in the previous month as employment climbed to its highest level in 11 months (67.9 vs 65.1 in April), inventories rose (69.8 vs 64.1), and price pressures edged down (82.4 vs 90.2). Supplier delivery times, however, continued to lengthen (42.3 vs 37.8).


Friday


Canada’s unemployment rate fell to 5.1% in May from 5.2% in April, the lowest rate since comparable data became available in 1976 and marginally below market forecasts of a sustained 5.2%. The rate in four provinces – British Columbia (4.5%), New Brunswick (7.1%), Prince Edward Island (7.8%), and Newfoundland and Labrador (10.0%) – was similar or below previous all-time lows, and employment gains were especially pronounced among young and core-aged women and in Alberta.


The US unemployment rate was unchanged at 3.6% in May, remaining at its lowest level since February 2020 for the third consecutive month but slightly above market expectations of 3.5%. The number of unemployed people increased by 9 thousand to 5.950 million, while employment levels rose by 321 thousand to 158.426 million. The labor force participation increased to 62.3%, up from April’s three-month low of 62.2%. Meanwhile, the Nonfarm Payroll Report showed the US economy added 390K payrolls in May, the least since April 2021 but above market forecasts of 325K. Payrolls increased across several sectors, including leisure and hospitality (84K), namely food services and drinking places (46K) and accommodation (21K); professional and business services (75K); transportation and warehousing (47K), namely warehousing and storage (18K), truck transportation (13K), and air transportation (6K); and manufacturing (18K). In contrast, payrolls fell in retail trade (-61K), mainly due to job losses in general merchandise stores (-33K).


Russia’s annual inflation rate eased to 17.1% in May from April’s 20-year high of 17.8% and below market estimates of 17.3%. On a monthly basis, consumer prices increased 0.1% after rising 1.6% in April, with price inflation slowing for food (0.6% vs 2.9% in April) and reversing for non-food (-0.1% vs 0.5%), and services (-0.3% vs 1.1%).


China’s annual inflation rate remained at April’s five-month high of 2.1% in May, below market forecasts of 2.2%. Food prices increased the most since September 2020, up for the second straight month (2.3% vs 1.9%) in April, as consumer activity picked up amid easing COVID restrictions in many major cities. Non-food inflation fell slightly (2.1% vs 2.2%) as price pressures cooled in housing (1.0% vs 1.2%), transportation & communication (6.2% vs 6.5%), and culture (1.8% vs 2.0%), although inflation in clothing (0.6% vs 0.5%), household goods and services (1.4% vs 1.2%), and healthcare (0.7% vs 0.7%) costs remained at or above April’s figures. China set a target of CPI at around 3% for this year, the same as in 2021. On a monthly basis, consumer prices fell 0.2% in May, the first monthly decline in five months, compared with consensus of a 0.3% drop and after a 0.4% rise in February.

Looking Ahead – The March of Folly 2-25-2022

Looking Ahead – The March of Folly


Prior to this week’s full-scale Russian invasion of Ukraine, plenty of global security experts (and many less erudite commentators) had predicted that the massive buildup of Russian troops and material on the border would serve as a show of might and warning to NATO, but the actual objectives of President Putin’s offensive would be limited to prying away the two regions in the east, Luhansk and Donetsk. Such a conclusion tended to hinge on the expectation that a massive, unprovoked invasion of Ukraine by Russia would be a brazen war crime, particularly given the effectiveness of the Biden administration and others in exposing the Kremlin’s clumsy false flag fumbling, and almost certainly a monumental strategic blunder. Successfully capturing and then durably holding a large and populous independent country like Ukraine without incredible cost of lives and treasure simply does not seem feasible in this day and age.


As reasonable as this prediction may have been at the time, it was incorrect. Though there are still some who think that Putin is playing geopolitical chess while the Western world plays checkers, capturing Kyiv and installing a Vichy government may well prove to be the easy part. But amoral global markets don’t pick right and wrong, just what makes money or doesn’t, and the prospect of an end to the hostilities in Ukraine, no matter the shoddiness of the puppets put in place to run the country as a vassal state of Russia, are enticing opportunistic buyers back into the stock market.


They say March comes in like a lion and out like a lamb, and that may well be the forecast for financial markets over the coming month as well. If Kyiv falls over the coming weeks and Russia “negotiates” for a nominally neutral government amid a cessation of outright hostilities, financial markets are likely to experience a degree of relief (yesterday’s rally was an early flicker of these hopes). Meanwhile, we expect that the Fed will raise interest rates by 25 basis points, not 50, at the March meeting, alleviating some concerns of a maximally aggressive tightening trajectory. These factors taken together have the potential to drive a period of countertrend “risk on” price dynamics next month.   


Despite the prospects of a respite in March, we retain our longstanding base case that market volatility will remain elevated into the late spring/early summer, and that concerns about Federal Reserve and global central bank overtightening into a supply shock and cyclical global slowdown will continue to drive a flattening trend of the Treasury yield curve, a firmer dollar, and reflation-in-reverse dynamics prevailing in global risk assets (with the notable exception of commodities driven by supply shocks).    


Looking ahead to next week, developments in the Russia/Ukraine war will be in the spotlight, alongside what will surely be a heavily scrutinized State of the Union address by President Biden. Chair Powell’s testimony before Congress also has the potential shift market expectations about the Fed’s reaction function to the current inflationary environment, in the face of a geopolitically-driven oil price shock. It will be a big week for crude, as OPEC+ holds their monthly meeting to decide production levels for April and the Iran nuclear deal negotiations reach a critical juncture. On the data front, US February nonfarm payrolls are on the calendar on Friday, while additional US and global Purchasing Managers’ Indexes (PMIs) and EU inflation and retail sales metrics are also due. The Reserve Bank of Australia and Bank of Canada have policy decisions.  


  • Russia/Ukraine War
  • State of the Union Address
  • US Nonfarm Payrolls
  • Global Purchasing Managers’ Indexes (PMIs)
  • OPEC+ Meeting
  • Australia & Canada Central Banks
  • EU Inflation
  • EU Retail Sales

Looking Ahead -At the Crossroads 10-28-2021

Looking Ahead – At the Crossroads


This week’s early publication of Looking Ahead peers into a foggy crystal ball with the stakes on Capitol Hill at the highest of the Biden presidency, while the Federal Reserve is set to hold its most consequential policy meeting since the early of the pandemic next week. And to top it all off, we have highly-anticipated October nonfarm payrolls figures next Friday.   


Our base case on the bipartisan infrastructure/reconciliation social infrastructure bill has remained virtually unchanged since the outset of the Biden presidency, though we pushed our estimated timeline for passage back from the late summer to the fall. To reiterate, we continue to expect a multi-trillion pair of infrastructure bills to pass over the coming weeks, perhaps as early as this week, with the total closer to $2.5-$3 trillion combined rather than the roughly $4.5 trillion original headline figure, and a massive debt ceiling increase accompanying the reconciliation bill. We had expected the pay-fors to be substantially watered down but it appears that it will be even a gentler and narrower tax package than we had anticipated.


With that said, time is not on the Dems’ side. All the incentives are stacked in favor of getting a reconciliation bill framework this week and a vote on the bipartisan package, with President Biden heading overseas to the G-20 in Italy and the climate summit in Scotland, while the Virginia governor’s election, which is now seen as a litmus test for Democrats’ support and is polling in a dead heat, looms on November 2nd. If they can’t get their act together this week, we will have to reassess our base case for the twin bills to be finalized this fall, if at all. This week’s extreme yield curve flattening and underperformance of growth-sensitive stocks is, in our opinion, due in no small part to the rising odds that the Democrats faceplant before the legislative finish line.


The house view on the Fed has shifted from an announcement of the taper of asset purchases (aka QE) in December with the process starting in early 2022 to that announcement coming next week, but with the start of the taper being held off until December. This delayed beginning would represent a dovish tilt to the taper relative to consensus expectations, which point to an immediate start to the process. It would serve to push market expectations of the first rate hike back from June and July given the projected timeline of the taper.


Additionally, we are very skeptical that rate hikes will immediately follow the end of the taper due to our anticipation that 1) much of the current inflation pressure will prove transitory as supply bottlenecks and labor shortages gradually abate, 2) Fed Chair Powell is replaced by the more dovish Governor Brainard, and 3) that the Fed will be extremely sensitive to the hyper-tense political environment ahead of the November midterm elections, making late summer/fall 2022 an inauspicious time to be tightening monetary conditions.   


Thus far, equity markets have generally traded in alignment with our expectations of a broadly reflationary outlook, with solid growth and moderating inflation, while bond markets have lurched out of synch with our base case, which calls for a gradual steepening of the yield curve and a settling of TIPS breakevens into year end and early 2022. The yawning disparity in volatility between equity and bond markets is bound to turn back toward convergence, and we think that the latter settles down to meet the former and not the other way around. We know that this flies in the face of the assumption that bond markets are the more prescient of the two, but plenty of things have been turned on their head in 2021 so far. As we survey US fiscal and monetary policy at the crossroads, one thing we can say for sure is that the coming week will bring a significant degree of clarity, one way or the other.  


Looking ahead, next week’s calendar features the biggest Fed meeting of the year and a pivotal nonfarm payroll reading. The Reserve Bank of Australia also has a crucial decision as markets lean into expectations of accelerated rate hikes. Global Purchasing Managers’ Indexes (PMIs) will provide an update on the state of the recovery amid the uneven fluctuations of the Delta wave. Corporate earnings reporting also continues, though major tech company results are mostly over.       


  • Federal Reserve Meeting
  • Nonfarm Payrolls
  • Corporate Earnings Season
  • Bank of England
  • Reserve Bank of Australia
  • EU Retail Sales


Global Economic Calendar: Big week


Monday

The ISM Manufacturing PMI in the US increased to 61.1 in September, up for a second straight month and above market expectations of 59.6. The latest reading signaled one of the strongest rates of expansion since 1983, boosted by solid increases in production (59.4 vs 60.0 in August) and new orders (66.7, the same as in August), as well as a slight rebound in employment levels (50.2 vs 49.0). At the same time, factories experienced longer delays getting raw materials delivered and paid higher prices for inputs.


Construction spending in the US was virtually unchanged at a seasonally adjusted annual rate of $1.584 trillion in August, after increasing 0.3% in the previous month and defying market expectations of a 0.3% rise. Spending on private construction decreased 0.1 percent (vs 0.2 percent in July), mostly transportation (-2.4%) and lodging (-2.3%), while public construction outlays rose 0.5 percent (the same as in July).


The Reserve Bank of Australia will hold an interest rate meeting. At the October Meeting they kept the cash rate unchanged at a record low of 0.1%, as widely expected, while continuing its plans to trim the purchase of government bonds to A$4 billion a week until at least mid-February 2022. Policymakers noted that the timing and pace of the economic rebound in Australia were uncertain and that it will depend much on the easing of restrictions. ” In our central scenario, the economy will be growing again in the December quarter and is expected to be back around its pre-Delta path in the second half of next year.” The central bank reaffirmed its commitment to maintaining supportive monetary conditions and not increasing the cash rate until inflation is within the 2 to 3% target range, a condition that will not be met before 2024.


Tuesday

The IBD/TIPP Economic Optimism Index in the US slipped deeper into pessimistic territory, falling 1.7 points to 46.8 in October, its lowest since September of 2020. Americans have grown more pessimistic about the outlook for the U.S. economy with the lapse of unemployment benefits even as the latest Covid wave has slowed the jobs recovery. The six-month outlook for the U.S. economy held steady at a 13-month low of 41.3; and the federal policies subindex, which reflects views of how well government economic policies are working, fell 3.8 points to 45.3, the lowest since December, before the second round of stimulus checks. Also, the personal finances subindex, fell 2.1 points to 53.9, also the lowest since September 2020, weighed down by Dow Jones losses and inflation worries.


The Caixin China General Services PMI jumped to 53.4 in September from 46.7 in the prior month, moving away from the lowest level seen since the height of the pandemic last year. Both new orders and employment bounced back to the expansionary territory, as a major COVID-19 outbreak in the eastern province of Jiangsu eased. At the same time, outstanding business continued to increase, but at a slower pace. Meanwhile, new export sales shrank again, with the sub-index hitting its lowest in seven months due to the surging pandemic overseas. On the cost front, input prices rose for the 15th straight month and increased at a faster pace, on rising labor, freight, and raw material costs. Meantime, prices charged went up after falling in August. Looking forward, sentiment remained optimistic, with the gauge of business expectations rising further into positive territory, though remaining below its long-term average.


Wednesday

The Euro Area seasonally-adjusted unemployment rate edged down to 7.5% in August, the lowest level since May 2020 and in line with market expectations. The number of unemployed decreased by 261 thousand to 12.162 million, as the labor market continued to show signs of recovery. The youth unemployment rate, measuring job-seekers under 25 years old, edged down to 16.4 percent in August, from 16.7 percent in the previous month. Amongst the largest Euro Area economies, the highest jobless rates were recorded in Spain (14.0 percent), Italy (9.3 percent) and France (8.0 percent), while the lowest rates were recorded in the Netherlands (3.2 percent) and Germany (3.6 percent).


Payroll Provider ADP Employment Report estimated that private businesses in the US hired 568 thousand workers in September, the most in three months and compared with a downwardly revised 340 thousand in August and beating market expectations of a 428 thousand rise. Most jobs were created in the leisure and hospitality sector (266 thousand) followed by education and health (66 thousand); professional and business (61 thousand); trade, transportation and utilities (54 thousand); financial activities (22 thousand); and information (11 thousand). The goods-producing sector added 102 thousand jobs, led by manufacturing (49 thousand); construction (46 thousand); and natural resources and mining (7 thousand). Companies with 500 and more employees added the most jobs (390 thousand), followed by midsized (115 thousand) and small companies (63 thousand).


The ISM Services PMI edged up to 61.9 in September from 61.7 in August, beating forecasts of 60, and pointing to a robust growth in the services sector, although the ongoing challenges with labor resources, logistics, and materials are affecting the continuity of supply. Faster increases were seen for business activity (62.3 vs 60.1), new orders (63.5 vs 63.2) and backlog of orders (61.9 vs 61.3). On the other hand, employment (53 vs 53.7), supplier deliveries (68.8 vs 69.6) and new export orders (59.5 vs 60.6) slowed. Also, price pressures intensified (77.5 vs 75.4).


The Federal Reserve will hold an Interest Rate Meeting. Minutes from the September Meeting showed policymakers have agreed that the tapering emergency pandemic support should start either mid-November or mid-December. Officials stressed that if the economic recovery remained broadly on track, a gradual tapering process that concluded around the middle of next year would likely be appropriate. Participants also considered an illustrative path of tapering, including monthly reductions in the pace of asset purchases, by $10 billion in the case of Treasury securities and $5 billion in the case of agency mortgage-backed securities (MBS). The Fed left the fed funds rate steady at 0-0.25% and bond-buying at the $120 billion monthly pace during the September 2021 meeting.


Australia’s trade surplus increased to a fresh record high of AUD 15.08 billion in August from an upwardly revised AUD 12.65 billion in the previous month and exceeding market consensus of a surplus of AUD 10.3 billion. Exports jumped 4 percent month-over-month to a new top of AUD 48.52 billion, amid strengthening foreign demand in the aftermath of the coronavirus disruptions and rising commodity prices, while imports fell 1 percent to AUD 33.45 billion. Considering the first eight months of the year, the trade surplus soared to AUD 84.01 billion from AUD 47.20 billion in the same period of 2020.


Thursday

The Bank of England will hold an Interest Rate Meeting. At the September meeting the BOE left its benchmark interest rate at a record low of 0.1% and its bond-buying program unchanged at a total of GBP 895 billion by the end of this year. The central bank also said that the case for modest tightening strengthened from August, as inflation could persist above 4% well into 2022, although considerable uncertainties remain. Reflecting that view, two policymakers voted for an early end to government bond purchases, compared with only one in the August meeting. Meanwhile, expectations for the level of UK GDP in Q3 were lowered by near 1% to around 2.5% below its pre-Covid level.


The trade deficit in the US widened to a record high of $73.3 billion in August, higher than market forecasts of $70.5 billion. Exports edged up 0.5% to $213.7 billion, the highest since May of 2019, boosted by sales of nonmonetary gold and natural gas while shipments fell for autos and parts, civilian aircrafts, corn and travel. Imports were up 1.4% to a new all-time high of $287 billion, namely pharmaceutical preparations, toys, games, organic chemicals, transport and travel. The deficit with China increased $3.1 billion to $28.1 billion. The deficit with Canada increased $1.4 billion to $5.1 billion while the deficit with Mexico decreased $1.9 billion to $6.6 billion.


Last week the number of Americans filing new claims for unemployment benefits fell to a fresh 19-month low of 281 thousand, as the labor market slowly recovers to its pre-pandemic normal amid a surge in demand for labor, the expiration of enhanced jobless benefits, and record levels of job openings and quits by employees. However, the number of new filings remained well above the 212 thousand seen back in early March 2020, just before the COVID-19 crisis hit the US economy. Additionally, continuing jobless claims, which measure unemployed people who have been receiving unemployment benefits for an extended period, fell to a new pandemic low of 2.243 million in the week ending October 16th, from a revised 2.480 million a week before and below market expectations of 2.415 million.


Canada’s trade surplus rose to CAD 1.94 billion in August from a downwardly revised CAD 0.74 billion in the previous month and beating market estimates of a CAD 0.43 billion surplus. Total exports increased 0.8% in August to a new record high of CAD 54.4 billion, with gains observed in 6 of the 11 product sections, notably energy products (5.1%). Meanwhile, total imports were down 1.4% to CAD 52.5 billion, despite gains in a majority of product sections, led by lower purchases of motor vehicles and parts (-11.1%) and aircraft and other transportation equipment and parts (-28.8%).


Friday

Eurozone retail sales rose by 0.3% from a month earlier in August, trying to recover from a revised 2.6 percent slump in July but missing market expectations of a 0.8% growth. Sales of non-food products advanced 1.8%, with on-line trade jumping 9.0%. Meanwhile, purchases of food, drinks and tobacco fell for a fifth straight month, while fuel sales were down 0.1%. On a yearly basis, sales remained unchanged, easing from a 3.1% increase in July and missing forecasts of 0.4% growth.


The US economy added a meager 194K jobs in September, the lowest so far this year and well below forecasts of 500K. Job gains occurred in leisure and hospitality (74K), professional and business services (60K), retail trade (56K), and transportation and warehousing (47K). Meanwhile, employment declined sharply in public education (-161K) and in health care (-18K). Nonfarm employment has increased by 17.4 million since a recent trough in April 2020 but is down by 5.0 million, or 3.3 percent, from its pre-pandemic level in February 2020. “Recent employment changes are challenging to interpret, as pandemic-related staffing fluctuations in public and private education have distorted the normal seasonal hiring and layoff patterns,” the Bureau of Labor Statistics said in the release. Additionally, the unemployment rate dropped to 4.8% in September, from 5.2% in the previous month and below market expectations of 5.1%. It was the lowest rate since March 2020, as many people left the labor force and the negative effects of Hurricane Ida and the Delta variant’s summer spike started to fade. Still, the jobless rate remained well above the pre-crisis level of about 3.5 percent due to ongoing labor shortages but is seen declining further in the coming months as companies fill widespread vacancies and as more workers are expected to go back into the labor force.


The Canadian economy added a net 157 thousand jobs in September, significantly beating market expectations of a 65 thousand rise and pointing to the fourth consecutive month of expansion in the workforce, enough to see employment return to its pre-pandemic level from February of 2020. Job creation was concentrated in full-time work (+194,000), split between the public sector (+78,000) and private sector (+98,000), while part-time jobs saw little change in September. Employment significantly rose in the service sector (+142,000), driven by public administration (+37,000), information, culture, and administration (+33,000), and professional, scientific, and technical services (+33,000), while accommodation and food services jobs fell for the first time in 5 months (-27,000). Little change was noted in the goods-producing sector, while self-employment also remained unchanged to mark the sixth consecutive month without growth.


The Ivey Purchasing Managers Index in Canada increased to 70.4 in September from 66 in the prior month, signaling a continued improvement in business conditions in Canada. It was the highest reading since June, supported by rising prices (79.1 vs 69.7 in August) and an increase in supplier deliveries (36.5 vs 34.2). Meanwhile, the pace of job creation eased further (63.7 vs 66.9) and inventories also fell (57.7 vs 60.3).


Saturday

China’s trade surplus widened to $66.76 billion in September, from $35.34 billion in the same month a year earlier and far above market consensus of $46.8 billion. It was the largest trade surplus since last December, as exports extended their double-digit growth to a fresh all-time high while imports rose at a softer pace, but also hit a new record. The trade surplus with the United States rose to $42 billion, up from $37.68 billion in August. Considering the first nine months of the year, the trade surplus widened to $429.2 billion from $316.6 billion in the same period of 2020.

Looking Ahead – Home on the Range

Millions of pandemic-weary Americans are already eagerly looking forward to their vacations in July and August, but there is one summer getaway on the calendar that market participants are eyeing warily – the Federal Reserve’s late August Economic Symposium in Jackson Hole, Wyoming. Last year, the virtual version of the event took away some of the fun of seeing global central bankers and economists cutting rather uncertain profiles in the great outdoors with creases still visible and their newly bought blue jeans – they hardly look at home on the range! Whether it happens in person or not, this year’s Symposium will be perhaps the most consequential Jackson Hole of Fed Chair Powell‘s tenure, as speculation is increasing that it could be the venue for the announcement of a tapering of the ongoing asset purchase program (aka quantitative easing or QE), which is currently at a rate of $120 billion per month.


In this week’s press conference following the FOMC decision, Chair Powell summarily dispensed with questions about the taper by saying it was still too early to talk about it, though Dallas Fed President Kaplan made headlines today by opining that it will soon be time to discuss the process. Whenever the eventual announcement is, Chair Powell has suggested that it will come well before the actual tapering process begins. All of this has served to deepen speculation around the potential for the June, July, or September meetings to feature taper talk, but with Jackson Hole on the calendar, it seems as though that could also be an auspicious intra-meeting platform for at least the start of the discussion.


Our view is that the Fed holds out for longer and, while the taper is the subject of increasing Fed chatter, the actual announcement is not until much closer to year-end, for a start in 2022. And this assumes that the markets stay placid – downside in equities, a renewed surge in longer-dated Treasury yields, swift upside in the dollar, or a combination thereof, we expect, would stay the Fed’s hand on the taper for perhaps even longer. This would reflect the Fed’s appreciation that financial market conditions can perform some of the tightening for them, even if they do not commit to a taper by the fall but leave open the possibility.


For now, though, markets are reflecting no such price action. Longer-dated Treasury yields are comfortably rangebound, as are the dollar, TIPS inflation breakevens, oil prices – these key macro bellwethers have been trending generally sideways for a month or more. However, we do not expect these to stay in these ranges for much past Memorial Day, as the US economic recovery heats up over the summer, reigniting the upside bias in the Treasury yield curve and the dollar. So rather than spending Jackson Hole communicating to markets that QE tapering is impending, we think it is perhaps more likely that the Fed messaging at the Symposium is instead designed to push back on market anticipation of the taper and, hence, earlier than projected Fed rate hikes. And this is due to the importance of QE as a policy signal which sets the clock ticking to the first rate hike, which is (finger in the wind) about a year after the taper would start.    


Looking ahead to next week, the highlight is Friday’s US nonfarm payroll (NFP) reading for April, which is expected to show a powerful addition of 950k new jobs after March’s similarly robust 916k. ADP private sector employment figures on Wednesday and Thursday’s latest initial jobless claims number will provide some foreshadowing to this highly-anticipated NFP print. The Reserve Bank of Australia has a decision on Tuesday while the Bank of England and Turkey’s central bank meet on Thursday, and readings of global service sector purchasing managers’ indexes (PMIs) are also due throughout the week. Notable earnings reports next week include Pfizer, GM, PayPal.


  • Nonfarm Payrolls & Other US Labor Data
  • Bank of England
  • Reserve Bank of Australia
  • Global Service Sector PMIs
  • Corporate Earnings


Global Economic Calendar: Get a job, sha-na-na-nah sha-na-na-na-nah


Monday

Retail sales in Germany increased 1.2% m/m in February, rebounding after 2 consecutive months of declines but below market forecasts of a 2% gain, as the country remained under the coronavirus lockdown with retail partially closed. Compared to February 2020, the month before the coronavirus pandemic in Germany, sales were 9% lower. Year-on-year, retail sales sank 9%, more than forecasts of a 6.3% fall. Sales of food, beverages and tobacco went down 1.6% and sales of nonfood items dropped 13.8%, with textiles, clothing, shoes and leather, goods of many kinds, department stores for instance and furnishings, household appliances and building supplies recording the largest annual falls.


US Construction spending decreased 0.8% m/m to a seasonally adjusted annual rate of $1.52 trillion in February, following a downwardly revised 1.2% rise in January and compared to market expectations of a 1% fall. Spending on private construction went down 0.5%, dragged down by spending on residential, power, health care and office. Also, public construction outlays declined 1.7%, mainly due to highway and street and education.


The ISM Manufacturing PMI jumped to 64.7 in March from 60.8 in February, well above market forecasts of 61.3. It is the highest reading since December of 1983. Faster increases were seen in production, new orders, the highest since January of 2004 and employment and inventories rebounded. Meanwhile, both new export orders and supplier deliveries slowed a bit and price pressures remained elevated. “The manufacturing economy continued its recovery in March. However, Survey Committee Members reported that their companies and suppliers continue to struggle to meet increasing rates of demand due to coronavirus impacts limiting availability of parts and materials”, Timothy Fiore, Chair of the ISM said.


Australia’s balance of trade showed a trade surplus narrowed to AUD 7.53 billion, from the previous month’s all-time high of AUD 9.62 billion and shy of market forecasts of AUD 9.7 billion. Exports were down 1%, while imports jumped 5% to a one-year high. Considering the first two months of the year, the trade surplus soared to AUD 17.15 billion from AUD 7.92 billion in the same period of 2020.


The Caixin China General Manufacturing PMI unexpectedly fell to 50.6 in March from 50.9 a month earlier and missing market expectations of 51.3. This was the lowest reading since April 2020, indicating the post-epidemic recovery faltered. Both output and new orders grew at softer rates while employment moved closer to stabilization. Meanwhile, the measure for stocks of purchased items remained in negative territory for the third straight month, and the measure for quantity of purchases plunged into a contraction. The gauge for suppliers’ delivery times increased, though it was still in negative territory. On the price front, inflationary pressures intensified, with both input costs and output charges rising at steeper rates. Meantime, export sales returned to growth as foreign demand improves amid an acceleration in global COVID-19 vaccinations. Finally, the level of positive sentiment was among the highest seen over the past seven years.


Tuesday

The Reserve Bank of Australia left its cash rate unchanged at a record low of 0.1% during its April meeting, as widely expected. Policymakers reaffirmed their commitment to maintaining highly supportive monetary conditions until at least 2024 when actual inflation is sustainably within the 2 to 3% target. The board also remains committed to the 3-year government bond yield target of 10 basis points. Later in the year, it will consider whether to retain the April 2024 bond as the target bond or to shift to the next maturity. It added that the second $100 billion government bond purchase program will start next week. Regarding CPI inflation, it is expected to rise temporarily because of the reversal of some COVID-19-related price reductions. On rising housing prices, the bank said it will monitor trends in borrowing carefully and it is important that lending standards are maintained.


Canada’s balance of trade showed the surplus narrowed to CAD 1.04 billion in February from a downwardly revised CAD 1.21 billion in the previous month. This was the first time since late 2016 that the trade balance was in a surplus position for two consecutive months. After a surge of 8.2% in January, total exports decreased by 2.7% to CAD 49.9 billion in February, a level 4.1% higher than that set in February 2020. The largest declines were observed in the metal and non-metallic mineral products, motor vehicles and parts, and aircraft and other transportation equipment and parts product sections. Total imports decreased by 2.4% in February to CAD 48.8 billion, their lowest level since August 2020. Imports of motor vehicles and parts had the largest decline, followed by energy products.


The US balance of trade showed the deficit widened for the second month to $71.1 billion in February from a revised $67.8 billion in the previous month, slightly above market expectations of a $70.5 billion gap. It is the biggest trade deficit on record as imports fell less than exports, in another sign the American economy recovers faster than its trading partners from the pandemic hit. The goods deficit widened by $2.8 billion to $88 billion, and the services surplus shrank by $500 million to $16.9 billion. Exports went down 2.6% to $187.3 billion, mainly due to other industrial machinery, civilian aircraft, semiconductors, foods and beverages, autos and travel services. Imports fell at a slower 0.7% to $258.3 billion, due to passenger cars and pharmaceutical preparations. The goods deficit widened with China and Canada but narrowed with Mexico.


US factory orders dropped by 0.8% m/m in February, the first decrease since April’s record contraction and compared with market expectations of a 0.5% drop. Demand for transport equipment declined by 1.8%, due to vehicles, defense aircraft, and ships and boats. Demand was also down for machinery, fabricated metal products, primary metals, and computers and electronic products.


Wednesday

The ADP Employment Report showed private businesses in the US hired 517K workers in March, compared to market forecasts of 550K. It is the highest increase in private payrolls in 6 months. The service-providing sector created 437K jobs led by leisure and hospitality (169K); trade, transportation & utilities (92K); professional and business (83K); education and health (68K); other services (22K); and financial activities (9K) while the information sector lost 7K jobs. The goods-producing sector rebounded and added 80K jobs, due to manufacturing (49K) and construction (32K) while natural resources and mining shed 1K jobs. Private payrolls in midsized companies were up by 188K, small firms by 174K and large companies by 155K.


The ISM Services PMI jumped to 63.7 in March from 55.3 in February, well above forecasts of 59. The reading pointed to the strongest growth in services activity ever. Faster increases were seen in business activity, new orders and employment while price pressures intensified. Also, both inventories and new export orders slowed. “Respondents’ comments indicate that the lifting of coronavirus pandemic-related restrictions has released pent-up demand for many of their respective companies’ services. Production-capacity constraints, material shortages, weather and challenges in logistics and human resources continue to cause supply chain disruption” says Anthony Nieves, Chair of the ISM.


The Caixin China General Services PMI picked up to a three-month high of 54.3 in March from 51.5 in the previous month, amid a further recovery from the pandemic. The latest reading was also slightly higher than the series average, as domestic demand strengthened, with new orders expanding the most since December 2020. Also, employment returned to growth, while backlogs increased slightly following falls in the prior four months. Meantime, export orders fell for the second straight month, though the contraction was limited. On the cost front, inflationary pressure increased, with input rising for the ninth straight month while output prices expanding for the eight months in a row. Looking ahead, sentiment strengthened to its highest in over a decade amid hopes of post-pandemic recovery.


Thursday

Eurozone’s retail sales rose 3.0%m/m in February, rebounding from a 5.2% slump in January and compared with market expectations of 1.5% growth. Sales of non-food products jumped 6.8%, partially recovering from a 9.9% contraction in the previous month, with on-line trade advancing only slightly by 0.4%. In addition, sales of fuel climbed 3.7%, while food, drinks, tobacco trade declined 1.1%. On a yearly basis, retail sales shrank 2.9%, less than market consensus of a 5.4% plunge. Domestic trade could see a sharp decline during March in a disappointing end to the first quarter for retailers, as many countries in Europe, including Germany, France, Italy and Spain, imposed or extended restrictive measures to contain the spread of coronavirus.


The Bank of England (BoE) is expected to keep policy settings steady. At the BoE’s March monetary policy meeting, officials unanimously voted in favor of holding the current benchmark interest rate at the record low of 0.1% and left the pace of its asset purchase program unchanged. Following yesterday’s commentary from Fed Chair Powell, BoE officials similarly underlined improving economic conditions, citing better-than-expected output in January, new stimulus initiatives by the UK and US governments, and optimism surrounding Prime Minister Johnson’s rapid vaccination program. Meeting minutes also mentioned “upside risks” seven times compared to the two times in last month’s release. The signal to hold asset purchases (aka quantitative easing or QE) at the current pace aligns with the Fed’s current policy approach, and stands in contrast with the European Central Bank’s (ECB) positioning, as last week the ECB indicated it will seek to curb the undesirable surge in bond yields by increasing the pace of asset purchases. The narrative from US and UK central bankers in maintaining QE levels unchanged is rooted in the belief that rising yields are a reflection of improving growth and inflation outlook, rather than an undesirable tightening in financial conditions, at least to this point. To supplement this position, a report from the BoE’s regional agents showed signs of improving consumer demand and improving outlook for manufacturing by next year. Some economists project the BoE will upgrade economic forecasts significantly during the Monetary Policy Committee’s next meeting in May. UK government bonds continued their selloff, with the 10-year gilt yield rising 5 basis points to 0.88% while the pound edged lower versus the dollar to take its downside to 1.5% from its recent nearly three-year high versus the greenback


Initial and Continuing Jobless Claims will be in focus head of nonfarm payrolls the following day. Last week, the number of Americans filing for new claims for unemployment benefits continued to decrease to 553 thousand from an upwardly revised 566 thousand in the previous week and slightly above market expectations of 549 thousand. It is the third consecutive week with claims below 600 thousand and a fresh low since the pandemic hit helped by improvement in the economy due to increased vaccine rollout. Furthermore, 121 thousand people received Pandemic Unemployment Assistance, down from 133 thousand in the previous week. Additionally, continuing jobless claims increased to 3660 thousand the week ending April 17 from 3651 thousand in the previous week. Finally, in the week ending April 10, 16.559 million Americans received some sort of Federal assistance, down from 17,405 million in the previous week and continuing its downward trajectory after being above 20 million in the worst of the pandemic.


Nonfarm labor productivity fell by an annualized 4.2% in the last quarter of 2020, less than initial estimates of a 4.8% decline. Still, it remains the biggest decline in productivity since the second quarter of 1981. Output increased 5.5% and hours worked rose 10.1%. Year-on-year, nonfarm business sector labor productivity increased 2.4%, reflecting a 2.6% decline in output and a 4.9% drop in hours worked. It compares with initial estimates of a 2.5% rise.


China’s balance of trade showed a trade surplus narrowed to $13.8 billion in March, from $20.0 billion in the same month of the previous year and far below market expectations of $52.05 billion, amid an improving global demand and higher commodity prices. Exports soared 30.6% and imports jumped 38.1% to an all-time high, at the fastest pace since February 2017. The country’s trade surplus with the US declined to $21.37 billion in March from $23.01 billion in February. Considering the first three months of the year, the trade surplus widened sharply to $117.1 billion, from $12.8 billion in the same period of 2020, as exports and imports soared from last year’s record slumps.


Friday

The German balance of trade showed a narrowed surplus to €18.1 billion in February from €20.3 billion a year earlier. Exports declined 1.2% y/y to €107.8 billion while imports rose 0.9% to €89.7 billion. Sales to the EU countries edged down 0.3%, of which those to the Eurozone declined 0.9%. Imports from the EU rose 0.9%, mainly due to countries outside the Eurozone while those from the Eurozone fell 0.6%. Shipments to third countries were down 2.3%, namely to the US while those to China surged. Imports from third countries were up 1.1%, namely from China while those from the US sank 12.6%.


The Canadian employment report showed the economy created 303 thousand jobs in March, above market expectations of a 100 thousand rise, bringing employment to within 1.5% of its pre-COVID February 2020 level. Both full-time (+175,000; +1.2%) and part-time (+128,000; +3.9%) employment increased. Self-employment rose for the first time in three months, up 56,000 (+2.1%), but remained 5.4% (-156,000) below its pre-COVID February 2020 level. Employment in retail trade rose by 95,000 (+4.5%) in March, fully recouping the remainder of the losses sustained in January. The number of people working in information, culture and recreation also went up (+62,000; +9.4%) for the first time since September. There were 21,000 (+2.4%) more people working in accommodation and food services. Employment increased in most provinces, namely Newfoundland and Labrador, Prince Edward Island, Quebec, Ontario, Manitoba, Alberta and British Columbia.


The Ivey Purchasing Manager’s Index in Canada jumped to 72.9 in March from 60 in the previous month and above market estimates of 60.5. It was the highest reading since March of 2011 and the second-highest since the survey began in 2000, pointing to a strong improvement in the economic activity. Solid rises were seen in employment (62.7 vs 54 in February) and inventories (61.7 vs 57.8). Meanwhile, deliveries were slower than the previous month (39.6 vs 38.6) while prices eased (75.1 vs 80.2).


The US employment report showed the economy added 916K jobs in March, the most in 7 months, following an upwardly revised 468K in February. It compares with market expectations of 647K, amid easing business restrictions, falling coronavirus infection rates, a fast vaccine rollout and continued support from the government. The largest job gains occurred in leisure and hospitality, 280K, public and private education, 190K, and construction 110K. Employment also increased in professional and business services 66K, manufacturing 53K and transportation and warehousing 48K. Still, that leaves the economy about 8.4 million jobs short of the peak in February of 2020, as the job market still has a long way to go before fully recovering from the pandemic shock. Fed Chair Powell recently said there’s a good reason to expect job creation to pick up in the coming months although it will take some time to get back to maximum employment.


The unemployment rate fell to 6% from 6.2% in the previous month, the lowest rate in a year and in line with market expectations. The rate has been falling steadily in recent months after reaching an all-time high of 14.8% in April last year but many believe it has been understated by people misclassifying themselves as being “employed but absent from work”. The number of unemployed people fell by 262 thousand to 9.710 million while the number of employed rose by 609 thousand to 150.85 million. The labor force participation rate edged up to a 3-month high of 61.5 percent from 61.4 percent. Fed Chair Powell recently said the participation rate is seen expanding and holding the unemployment rate up which would be a highly desirable outcome.

Looking Ahead – Wile E Coyote

Looking Ahead – Wile E. Coyote


We at Markets Policy Partners do not claim to be experts on cryptocurrency – if we were, we would probably be on a yacht somewhere rather than pounding out these briefings and reports. But while the crypto crowd can give you their latest prediction for the price outlook of Dogecoin or the merits of Ethereum versus XRP, they may not have as good a handle on how US policymakers are reorienting their approach to these assets under the Biden administration.


As we wrote this morning, Bitcoin, the flagship cryptocurrency, is trading below $50k today, which represents a 22% loss from its all-time high of nearly $64k last Thursday, with the ongoing downtrend accelerating over the past day amid news of the Biden administration’s reported proposal to hike the capital gains tax rate to 39.6% for those earning more than $1 million. These worries were compounded by rumors on Twitter yesterday that Treasury Secretary Yellen will advocate a capital gains rate of 80% on cryptocurrencies. Other popular cryptocurrencies, like XRP and Ethereum, are experiencing similar corrective episodes after their steep valuation gains year-to-date.


We doubt that Secretary Yellen will propose such a lofty capital gains tax rate targeting Bitcoin and cryptocurrencies – in fact, Treasury officials may well have had a chuckle over this probably unfounded report at their senior staff meeting this morning. But we cannot rule out its veracity, and neither should crypto speculators. US policymakers have all kinds of policy justifications for a more heavy-handed approach to an asset class that is associated with tax evasion, money laundering, and other illicit activities, not to mention being a vehicle for rampant speculation, securities fraud, and investor protection problems. It is certainly to the benefit of policymakers to keep the crypto crowd on notice, as rumors like this might on the margin curb some of the ongoing criminal behavior in this space and cool the speculative frenzy through the sentinel effect (i.e. Uncle Sam is watching). For US economic policymakers, a rough patch for Bitcoin also brings the benefit of suppressing the animal spirits that have been running wild in financial markets and have threatened to make the Fed’s job of maintaining appropriately easy monetary conditions harder to achieve without risking an adverse degree of asset price froth.


Over the past few months, we had pondered whether Bitcoin and crypto in general could buck the downtrend in other “bubble basket” assets (like Tesla and the ARK Innovation ETF) and keep diverging to the upside, but they finally appear to have had a Wile E. Coyote moment over the past week, where they stop running, look down, and drop. News that the Treasury will be more proactive in taxing cryptocurrencies should come as no surprise, but it seems to have for some – and we suspect that the process of mainstreaming Bitcoin will involve further meaningful challenges to its valuation.

Plus, investors are well aware that big, splashy IPOs/listings at market highs (like Coinbase last Wednesday) can mark an inflection point (Blackstone’s IPO in 2007 was a last hurrah for the financial sector, as was the Glencore IPO in 2011 for commodity prices). Yes, these are big cyclical industries and it is clear that cryptocurrencies play by a different set of market rules, but it would not be surprising if we look back on the past week as a turning point (at least an interim turning point) for the digital asset complex.

Looking ahead to next week, Thursday’s Federal Reserve decision is the headliner, which will be preceded by a Bank of Japan meeting overnight Monday, with both expected to retain their current dovish settings. On the data front, US personal income, spending, and prices (the Fed’s favored inflation metric) for March are due on Friday, with EU and German preliminary Q1 GDP prints earlier in the week, along with EU regional economic confidence gauges, China’s March PMI, and durable goods and jobless claims in the US. Meanwhile, corporate earnings reporting will feature the heaviest concentration of mega-tech companies, like Amazon, Microsoft, Google, Facebook, Apple, Twitter, and Tesla, which bring a greater potential for these reports to drive broader market sentiment.


  • Federal Reserve Meeting
  • Bank of Japan Meeting
  • US Personal Income, Spending & Prices
  • EU/German Q1 GDP
  • China PMI
  • US Initial Jobless Claims
  • Corporate Earnings


Global Economic Calendar: Fed decision time


Monday

The Ifo Business Climate indicator for Germany rose to 96.6 in March, the highest level since June 2019 and comfortably above market expectations of 93.2. Companies became optimistic regarding developments over the coming months, while their assessments of the current situation were also better. Sentiment among manufacturers improved firmly as export expectations exploded due to strong demand from the US and China, while that among service providers also rose markedly. Business confidence among constructors was also back in positive territory and that among traders became less negative.


US Durable Goods Orders unexpectedly sank 1.1% m/m in February, compared to market forecasts of a 0.8% increase. It is the first decline in durable goods order in ten months, mainly due to a 1.6% drop in transportation, namely motor vehicles. Other declines were also seen in orders for computers and electronic products, fabricated metals, communication equipment, machinery and primary metals. Orders for non-defense capital goods excluding aircraft, a closely watched proxy for business spending plans, dropped 0.8%, reversing from a 0.6% gain in January. Excluding transportation, new orders decreased 0.9% and excluding defense, new orders fell 0.7%.


The day closes with a Bank of Japan Interest Rate Decision. The BoJ left its key short-term interest rate unchanged at -0.1% and maintained the target for the 10-year Japanese government bond yield at around 0% during its March meeting, as widely expected. Meantime, the central bank decided to widen the band at which it allows long-term interest rates to move around its 0% target, amid efforts to make its ultra-easy policy more sustainable on the back of the COVID-19 pandemic and a continued battle to boost inflation. Policymakers removed their explicit guidance to buy ETF at an annual pace of roughly JPY 6 trillion, saying they would buy it when necessary and maintain a JPY 12 trillion ceiling for annual purchases. The BoJ also mentioned that it would allow long-term rates to move up and down by 0.25% from its target, instead of by 0.2%.


Tuesday

The S&P CoreLogic Case-Shiller 20-city home price index in the US jumped 11.1%y/y in January, following an upwardly revised 10.2% growth in the previous month and slightly above market expectations of 11%. It is the biggest annual increase in house prices since March of 2014. Phoenix, Seattle, and San Diego continued to report the highest year-over-year gains among the 20 cities in January. Considering the whole nine US census divisions, house prices increased 11.2%, the highest price growth since February of 2006 and following a 10.4% rise in November. House prices have been rising at faster pace in the past year amid strong house demand supported by low interest rates, the need of more space and as many people moved away from the big cities due to the coronavirus pandemic.


Retail sales in Japan declined by 1.5% y/y in February, following a 2.4% drop a month earlier and compared with market expectations of a 2.8% fall. Sales continued to fall for: general merchandise, fabrics, apparel & accessories, food & beverages, fuel, and medicine & toiletry. On the flip side, sales grew for motor vehicles, machinery & equipment, and others. On a monthly basis, retail sales rose by 3.1% in February, the most since June 2020.


The annual inflation rate in Australia unexpectedly was at 0.9% in Q4 2020, compared with market consensus and the prior quarter’s figure of 0.7%. This was the highest reading in three quarters, amid a rise in tobacco excise and the introduction, continuation, and conclusion of childcare fee subsidies and home building grants. Prices increased faster for both alcohol & tobacco and education. Also, there were rises in cost of food, furnishings & household equipment, and insurance & financial services. At the same time, cost of recreation & culture was flat. In contrast, cost fell further for housing, transport, clothing & footwear, and communication. On a quarterly basis, consumer prices also went up by 0.9%, after a 1.6% gain in Q3 and above forecasts of a 0.7% gain.


Wednesday

The GfK Consumer Climate Indicator in Germany increased to -6.2 heading into April, the highest level for five months and well above market expectations of -11.9, due to the gradual easing of lockdown measures to contain the rapid spread of coronavirus. However, the survey took place from March 3rd to 15th, before the extension of German lockdown until April 18th and the temporary suspension of Astra Zeneca COVID-19 shots. The income expectations sub-index increased 15.8 points to 22.3, while the gauge for economic outlook rose 9.7 points to 17.7, the willingness to buy indicator increased 4.9 points to 12.3, and consumer climate rose 2.8 points to -12.7 “Another hard lockdown will seriously damage the consumer climate and the current improvement will remain a flash in the pan”, GfK consumer expert Rolf Buerkl said.


Retail sales in Canada dropped 1.1% m/m in January, less than market forecasts of a 3% decline. Still, it marks the second consecutive month of falls in retail sales as the resurgence of COVID-19 cases led to the reintroduction of physical distancing measures, which directly affected the retail sector. Approximately 14% of retailers were closed at some point in January for an average of three business days. Sales at motor vehicle and parts dealers contracted 1 percent. Core retail sales which exclude gasoline stations and motor-vehicle, and parts dealers also posted their second consecutive decline, falling 1.4 percent because of lower sales at clothing and clothing accessories stores, furniture and home furnishings stores, and sporting goods, hobby, book and music stores. In contrast, sales at gasoline stations rose 0.9%.


Wholesale inventories in the US increased 0.6% m/m in February, after a 1.4% rise in January and above a preliminary estimate of a 0.5% advance. It was the seventh consecutive month of gains in wholesale inventories. Nondurable goods stocks rose 1.1% and durable goods inventories were up 0.3%. On a yearly basis, wholesale inventories advanced 2% in February.


The US Goods Trade Balance showed a record deficit record of $86.7 billion in February from $84.6 billion in January. Exports of goods were $130.1 billion, $5.1 billion less than January exports. The biggest decreases were seen in sales of capital goods, autos, consumer goods and food and beverages. Imports of goods were $216.9 billion, $3.0 billion less than in the previous month, dragged down by a 10.7% slump in purchases of autos.


The main event of the week will be a Fed Interest Rate Decision. Minutes of the last meeting in March showed Fed officials commented on the notable rise in Treasury yields and generally viewed it as reflecting the improved economic outlook, some firming in inflation expectations, and expectations for increased Treasury debt issuance. Also, the outlook for inflation is seen broadly balanced while supply disruptions and strong demand could push it up more than anticipated. The Fed also noted that asset purchases would continue at least at the current pace until substantial further progress toward maximum-employment and price-stability goals would be realized and highlighted the importance of clearly communicating its assessment of progress toward its goals well in advance of a change in the pace of asset purchases. At the meeting, the Fed left the target range for its federal funds rate unchanged at 0-0.25% and signaled a strong likelihood that there may be no rate hikes through 2023.


Thursday

The unemployment rate in Germany inched down to 4.5% in February, remaining close to the previous month’s five-and-a-half-year high of 4.6%, as the number of unemployed went down 0.3% to 2.01 million while employment was little-changed at 42.16 million. Still, the number of persons in employment in February was down by 1.7%, or 765,000, February 2020, the month before restrictions were imposed due to the coronavirus pandemic in Germany. The youth unemployment rate, measuring job seekers under 25 years old, declined to 6.1% percent from 6.3%.


Consumer prices in Germany increased 1.7% y/y in March, in line with preliminary estimates and following a 1.3% rise in February. It is the highest inflation rate since February of 2020 as the temporary reduction of the VAT rates ended. Reduced VAT rates came into effect on July 1st 2020 for six months, as part of government measures to support the economy during the pandemic. Higher commodity prices, a CO2 charge introduced at the beginning of the year and a base effect as last year the inflation fell, also contributed to the rise in the CPI. Main increases were seen for energy, namely heating oil, motor fuels, natural gas, fruit and dairy products and tobacco. On a monthly basis, consumer prices were up 0.5%, also in line with early estimates.


The Advanced Estimate of First Quarter GDP is expected to be 6.3%. The US economy expanded an annualized 4.3% on quarter in Q4 2020, higher than 4.1% in the second estimate, mainly due to an upward revision to private inventory investment that was partly offset by a downward revision to nonresidential fixed investment. Still, the expansion was slower compared to a record 33.4% growth in Q3 as the continued rise in COVID-19 cases and restrictions on activity moderated consumer spending. Considering full 2020, the GDP shrank 3.5%, the most since 1946 and following a 2.2% growth in 2019. The outlook for 2021 seems brighter than a few months ago as the vaccination campaign continues, the $1.9 trillion aid bill was approved, and Americans already started receiving stimulus checks.


Initial and Continuing Jobless Claims. Last week the number of Americans filing new claims for unemployment benefits dropped to 547 thousand from 586 thousand and now the lowest level since the beginning of the pandemic in March 2020. Claims came in well below market expectations of 617 thousand, as continued moves to reopen the economy continued to support the labor market, as now 50% of adults are vaccinated. An additional 133 thousand people filed for Pandemic Unemployment Assistance, up from the previous week’s which saw 131 thousand. Furthermore, continuing jobless claims, which measure unemployed people who have been receiving unemployment benefits for a extended period of time, fell to 3.67 million in the week ending April 10th, from 3.71 million in the previous period and in line with market expectations. In total, 17.405 million people received some sort of Federal assistance in the week of April 3, up from 16.913 in the previous week.


Pending home sales in the US fell 0.5% y/y in February, following an upwardly revised 13.5% rise in January. It is the first decline since May as interest rates edged up and supply was near all-time lows. On a monthly basis, pending home sales shrank 10.6%, the second consecutive month of declines. “The demand for a home purchase is widespread, multiple offers are prevalent, and days-on-market are swift but contracts are not clicking due to record-low inventory. Only the upper-end market is experiencing more activity because of reasonable supply. Demand, interestingly, does not yet appear to be impacted by recent modest rises in mortgage rates”, said Lawrence Yun, NAR’s chief economist.


Japan’s unemployment rate stood at 2.9% in February, unchanged from the previous month and slightly below market consensus of 3.0%. The number of unemployed was flat at 2.03 million in February, while employment rose by 30 thousand to 66.97 million. The non-seasonally adjusted labor force participation rate edged up to 61.9%. Meantime, the jobs-to-application ratio decreased to 1.09 from 1.10. A year earlier, the unemployment rate was at 2.4%.


Industrial production in Japan dropped 1.3% m/m in February, compared with a preliminary estimate of 2.1% decline and following a downwardly revised 3.1% jump a month earlier. The industries that mainly contributed to the decline were motor vehicles, electrical machinery, and information and communication electronics equipment, transport equipment, petroleum and coal products and food and tobacco, pulp, paper and paper products. On a yearly basis, industrial output fell 2.0% in February, after an upwardly revised 5.3% decrease in January.


The official NBS Manufacturing PMI for China rose to 51.9 in March from 50.6 in February, beating market consensus of 51.0. This was the highest reading since December 2020, as factories resumed their production after being closed for the Lunar New Year holiday. Output, new orders, and buying levels all grew the most in three months, export sales returned to expansion and employment rose for the first time in eleven months. As for prices, both input costs and output charges continued to rise at a solid pace. Looking ahead, business sentiment remained upbeat.


Friday

The consumer confidence index in Japan increased by 2.2 points from the previous month to 36.1 in March, the highest since February last year, as all main sub-indices have improved: overall livelihood, income growth, willingness to buy durable goods, and employment perceptions.


Germany will release First Quarter 2021 Flash GDP Estimates. The German economy expanded 0.3% on quarter in the last three months of 2020, much better than initial estimates of a 0.1% growth, led by an 8.3% jump in gross capital formation, namely in construction and inventories. Net trade also contributed positively while consumer and government spending shrank due to the second coronavirus wave and another lockdown imposed from November. Year-on-year, the economy contracted 3.7%. Full 2020 drop was revised lower to -4.9% from a preliminary -5.3%. The German economy is seen expanding 3% in 2021, according to government estimates from late January 2021.


The consumer price index in the Eurozone was confirmed at 1.3% y/y in March, the highest since January 2020, driven mainly by higher cost for services and energy. On the other hand, prices rose at a softer pace for non-energy industrial goods and food, alcohol & tobacco. The ECB has said already it is expecting a spike in headline inflation on the back of base effects and temporary factors, warning that it may even exceed the central bank’s target by the end of the year. Meanwhile, the annual core inflation, which excludes volatile prices of energy, food, alcohol & tobacco eased to 0.9% from 1.1% in February. On a monthly basis, consumer prices climbed 0.9% in March.


The Eurozone will release the Flash Estimate for First Quarter 2021 GDP. The Eurozone economy shrank by 0.7% in the fourth quarter of 2020, following a record 12.5% expansion in the previous three-month period and an unprecedent 11.6% contraction in the second quarter due to the COVID-19 crisis. Household consumption decreased by 3.0%, and net external demand contributed negatively to the GDP as exports rose less than imports. Meanwhile, fixed investment grew by 1.6% and changes in inventories added 0.6% points to growth. Among the bloc’s largest economies, France, Italy and the Netherlands contracted in the fourth quarter, while GDP growth in Germany and Spain slowed sharply. For the year 2020 as a whole, GDP fell by 6.6%, following a 1.3% expansion in 2019.


US Personal income declined 7.1% m/m in February, down from an upwardly revised 10.1% jump in January and compared to market expectations of a 7.3% drop. It is the biggest fall on record reflecting a decrease in government social benefits to persons. Within government social benefits, “other” social benefits, specifically the economic impact payments to households, decreased. The CRRSA Act authorized a round of direct economic impact payments that were mostly distributed in January.


US Personal spending declined 1.0% m/m in February, following an upwardly revised 3.4% growth in January and compared with market consensus of a 0.7% drop. It was the largest decline in consumer spending since the April 2020 record slump as the cold weather weighed on demand and the boost from a second round of stimulus checks faded. Consumption of durable goods slumped 4.7% and that of non-durable goods dropped 2.0%. Meanwhile, spending on services was up 0.1%. Real PCE fell 1.2% in February, due to decreases in spending for both goods and services.


The personal consumption expenditure price index went up 0.2% m/m in February of 2021, easing from a 0.3% rise in January. Cost of goods increased 0.3%, easing from a 0.6% advance in the previous month, while services inflation was steady at 0.2%. Excluding food and energy, Core PCE edged up 0.1%, slowing from a 0.2%. Year-on-year, the PCE price index advanced 1.6%, the biggest gain in a year as energy cost increased and the core index increased 1.4%.


The MNI Chicago Business Barometer increased by 6.8 points to 66.3 in March, the highest level since July 2018 and above market expectations of 60.7. Among the main five indicators, production saw the largest gain, followed by new orders while order backlogs saw the biggest drop. Through the first quarter the index gained 4.4 points to 63.2, the strongest reading since Q3 2018.

Looking Ahead – Procedural Thriller

Looking Ahead – Procedural Thriller


Please join us today at 2:30 PM ET for a call on the Biden Administration’s American Jobs Plan spending proposals and accompanying tax increases. We will be joined by our colleagues at Hamilton Place Strategies, Meghan Pennington and Bryan DeAngelis. Both have extensive experience on Capitol Hill and will have insights on the reconciliation process, as well as perspective on what elements are likely to make their way into the final bill and what may not have the votes. We will also touch on other themes, like US corporations being embroiled in politics, whether over voting rights, pay/unions, taxes, etc.

Please reply to Jeff Easter (jeff.easter@marketspolicy.com) if you would like to join the call.

Some of the key questions we will be pondering are as follows:

The Biden administration has split this massive legislative campaign into two main fronts – physical infrastructure (the American Jobs Plan) and social programs/caring economy (the yet-to-be unveiled American Families Plan). The total price tag of the combined proposals is estimated to be around $4 trillion. What is the reason for this bifurcated approach?

Related to question 1 above, what is the importance of this week’s ruling by the Senate Parliamentarian, which indicated that Democrats could utilize budget reconciliation an additional time to bypass Republican support with a simple Senate majority. The ruling permits Democrats to revisit the fiscal 2021 budget resolution that Congress used to approve the $1.9 trillion relief bill earlier this year, in effect creating three opportunities to use reconciliation to pass a significant portion of the administration’s economic agenda before the midterm elections in 2022.

Related to question 2 above, if the Biden administration goes for an omnibus approach to this next bill, what might they use their third and final budget reconciliation procedure for later this year?

How does this physical infrastructure bill cut across party lines? Is there any hope of a bipartisan segment, such as a smaller infrastructure package free of tax hikes that would potentially draw out some GOP support? Would that be worth doing from a political and policy standpoint?

Senator Manchin has come out with some strong statements on the current American Jobs Plan draft, pushing back on the increase in corporate taxes to 28% and expressing a preference for 25%, while indicating that he is uncomfortable with the overall size of the package and favors a more bipartisan approach. He has a lot of political capital, but does he have enough to truly steer this bill in a radically different direction if in fact that is what he wants to do?  

So much of the focus is on what Senator Manchin wants, but with such a slim majority in the House, will the Blue Dog contingent have a similar power over what makes it in? 

Looking ahead to next week, the macro calendar features some consequential global economic data, with US consumer price inflation figures in sharp focus, while March retail sales and industrial production for the US and EU could highlight their diverging economic fortunes. Economic sentiment gauges for the US, Germany, and Australia are also due, alongside first quarter Chinese GDP and key growth metrics for March.  


  • US Consumer Price Inflation
  • US & EU Retail Sales
  • US & EU Industrial Production
  • Chinese GDP and March Data
  • US Initial Jobless Claims
  • Global Economic Sentiment Surveys


Global Economic Calendar: In bloom


Monday

Eurozone’s retail trade slumped 5.9% m/m in January, the steepest decline since last April’s record slump and compared with market expectations of a 1.1% drop, as a number of member states re-imposed or extended coronavirus lockdown measures. Non-food products sales plunged 12%, despite a 7.1% increase in on-line trade, while fuel sales were down 1.1%. Meanwhile, food, drinks and tobacco trade rose 1.1%, compared with a 2.3% growth in December. On a yearly basis, retail sales shrank 6.4% , also the largest decrease since April.

The NAB business confidence index in Australia rose 4 points from the previous month to 16 in February 2021, its highest level since early 2010, with all states and industries reporting gains, except for retail. In addition, the gauge measuring business conditions climbed 6 points to 15, matching the December reading, which was the highest level since August 2018, with all three sub-components improving: trading, profitability and employment. Meantime, capacity utilization and capex continue to rise and have now exceeded pre-virus levels and their long-run averages. Forward orders also rose and are now well above average. “Business conditions and confidence are both at multi-year highs and, importantly, we’re starting to see an uptrend in business hiring and investment activity.” said Alan Oster, NAB Group Chief Economist.

Chinese Balance of Trade showed a trade surplus of $103.25 billion in January-February 2021 combined, rebounding sharply from a $7.21 billion deficit in the same period a year earlier, and easily beating market consensus of a $60 billion surplus, as the economy recovered from the disruption caused by COVID-19, with more factories resuming their production. Exports surged 60.6% y/y, the eighth straight month of increase, while imports rose at a softer 22.2%, the fifth consecutive month of growth. China’s trade surplus with the US for the first two months of the year stood at $51.26 billion, much larger than a surplus of $25.37 billion in the corresponding period a year earlier. To smooth distortions due to the Lunar New Year festival, Chinese customs combine January and February trade data.


Tuesday

The UK Balance of Trade showed the trade deficit fell to £1.6 billion in January, the smallest trade shortfall in five months, as both imports and exports fell at a record pace following the end of EU exit transition period and the reintroduction of COVID-19 restrictions on activity. Imports declined 18.5% to £43.03 billion, with purchases of goods slipping 22.8% and services imports falling 2.4%. Meantime, exports fell at a record 11.2% to £41.40 billion, as goods shipments slumped 18.3% and services sales decreased 0.9%.

The ZEW Indicator of Economic Sentiment for Germany rose by 5.4 points from the previous month to 76.6 in March, not far from September’s 20-year high of 77.4 and slightly above market expectations of 74.0. Optimism surrounding the economic outlook continued to improve, with investors anticipating a broad-based recovery of the German economy and at least 70 percent of the population to be offered a COVID-19 vaccine by autumn. In addition, the survey showed inflation is seen increasing further and long-term interest rates are forecast to be higher.

The Consumer Price Index (CPI) increased 0.4% m/m in February, slightly higher than 0.3% in January but matching market forecasts. The gasoline index continued to increase, up 6.4%, accounting for over half of CPI gain. The electricity, and natural gas indexes also increased and the energy index rose 3.9%. The food index edged up 0.2%. This pushed annual CPI up to 1.7% from 1.4% in January, and in-line with market forecasts of 1.7%. Core CPI, which excludes food and energy, inched up 0.1%, less than forecast of 0.2%, with increases seen in cost of shelter, recreation, medical care, and motor vehicle insurance while falls were seen for airline fares, used cars and trucks and apparel. Annual Core CPI, rose 1.3%, the least since June 2020 and missing expectations of a 1.4% advance.

The Westpac-Melbourne Institute Index of Consumer Sentiment increased by 2.6% to 111.8 in March, just 0.2 points below the December level which was a ten-year high driven by are improving economic conditions and prospects, both domestically and abroad, particularly as they relate to our labor market. Australia’s success in containing COVID-19, the promise of vaccine rollouts bringing an end to the pandemic, and support from stimulatory government policies have all contributed to the sustained lift. All components of the index were higher in March. Confidence around the economic outlook led the gains with the ‘economy, next 12 months’ sub-index up 3.7% and the ‘economy, next 5 years’ sub-index up 2.3%.


Wednesday

Industrial production in the Eurozone rose 0.8% m/m in January, rebounding from a downwardly revised 0.1% fall in December and compared with market expectations of a 0.2% increase. Output of durable consumer goods, such as televisions and washing machines, rose 0.8%, after a 0.9% advance in the previous month. Production also grew for non-durable consumer goods, capital goods, energy and intermediate goods. On a yearly basis, industrial production was up 0.1% in January, ending a 26-month period of contraction and compared with forecasts of a 2.4% decline.

US Import prices increased 1.3% m/m in February, easing from an upwardly revised 1.4% rise in January, which was the largest monthly advance since March 2012. Still, the reading came in above market expectations of 1.2%. Nonfuel import prices increased 0.4%, due to higher prices for nonfuel industrial supplies and materials; foods, feeds, and beverages; capital goods; consumer goods; and automotive vehicles. Meantime, prices for import fuel advanced 11.1%, the most since July 2020, mainly due to an 11.3% rise in petroleum prices and an 11.2% advance in natural gas prices. Year-on-year, import prices jumped 3%, the most since October 2018 as petroleum cost surged.

US Export Prices rose 1.6% m/m in February, after a 2.5% advance in January which was the largest increase since records began in December 1988. It also compared with market expectations of a 0.9% gain. The price index for agricultural exports rose 2.9% and nonagricultural export prices rose 1.5%. Year-on-year, export prices jumped 5.2% in February, the largest over-the-year increase since June 2018.

The Australian Employment Report showed the seasonally adjusted unemployment rate fell to 5.8% in February from 6.4% a month earlier and below market consensus of 6.3%. This was the lowest jobless rate since March 2020, as the economy recovered further from the disruption caused by the COVID-19 shocks. The number of unemployed declined by 69,900 to 805,200 people, as people looking for full-time work was down by 39,800 to 576,700 and those looking for only part-time work decreased by 30,100 to 228,500. Employment grew by 88,700 to a one-year high of 13,006,900, easily beating market estimates of an increase of 30,000, as full-time employment went up by 89,100 to 8,895,000, while part-time employment dropped 500 to 4,111,900. The participation rate stayed at 66.1% and below forecasts of 66.2%. The underemployment rate rose 0.4 points to 8.5%, and the underutilization rate fell 0.1 points to 14.4%. Monthly hours worked in all jobs gained 102 million hours, or 6.1% to 1,767 million hours.


Thursday

US Retail sales shrank 3% m/m in February, following an upwardly revised 7.6% jump in January and much worse than market forecasts of a 0.5% fall. It is the biggest decline since a record drop in April of 2020 amid unusually cold weather and winter storms in Texas and some other parts of the South region during the month. Biggest decreases were seen in sales at department stores, sporting goods, hobby, musical instruments and book stores, non-store retailers, auto dealers, furniture, miscellaneous retailers, building material and garden equipment, clothing, food services and drinking places, electronics and appliances and health and personal care. In contrast, sales at gasoline stations jumped 3.6%. Retail Sales Excluding Autos decreased 2.7% m/m, much worse than forecasts of a 0.1% fall, amid unusually cold weather in the South.

Initial and Continuing Claims will be in focus after the latest reading featured another disappointing degree of deterioration. Last week, the number of Americans filing for unemployment benefits rose for the second straight week, after a surprise drop to 658 thousand in late March, up to 744 thousand, from the previous period’s revised figure of 728 thousand, and well above market expectations of 680 thousand. The weekly report followed on the heels of news last week that that nonfarm employment rose by 916 thousand in March, the most in seven months, while the number of job openings hit their highest level in two years in February. In total, 18.164 million Americans received some sort of federal assistance, down slightly from 18.215 million.

Industrial production slumped 2.2% m/m in February, following an upwardly revised 1.1% growth in the previous month and missing market expectations of a 0.3% increase. It was the steepest contraction in industrial output since April’s record 12.7% slump, due to the severe winter weather in the south-central region of the country in mid-February. Most notably, some petroleum refineries, petrochemical facilities, and plastic resin plants suffered damage from the deep freeze and were offline for the rest of the month. Manufacturing output and mining production fell 3.1% and 5.4%, respectively, the utilities output increased 7.4%.

The NAHB housing market index fell 2 points to 82 in March compared to forecasts of 83. It is the lowest reading in 7 months amid rising interest rates and building materials costs, especially lumber. Current sales conditions for the single-family segment fell 3 points to 87 while sales expectations in the next six months increased 3 points to 83. Also, the prospective buyers’ sub-index was unchanged at 72.

Business inventories went up 0.3% m/m in January, in line with market expectations and easing from an upwardly revised 0.8% growth in December. It was the seventh consecutive month of gains in business inventories. Stocks at manufacturers edged up 0.1%, slowing from a 0.3% advance in the previous month and inventories at retailers fell 0.5%, down from a 1.7% rise. Meantime, stocks at wholesalers rose faster. Year-on-year, business inventories dropped 1.8%.

China’s fixed-asset investment (FAI) surged 35% y/y to CNY 4.52 trillion in January-February 2021, accelerating from a 2.9% advance in 2020 but below market consensus of a 40% growth, as the economy continued to recover from the pandemic crisis. Public investment jumped 32.9% and private investment soared by 36.4%. Investment in the primary industry grew 61.3%, and that in the tertiary industry expanded 34.6% boosted by transport, storage & postal industry; water conservancy, environment and public facilities management industry; education; health and social work; and culture, sports and entertainment industry. Also, investment in the secondary industry jumped 34.1%. In January-February 2020, fixed-asset investment had plunged by a record 24.5% due to the coronavirus pandemic.

China’s 1st Quarter GDP will be released. China has set its 2021 economic growth target at more than 6%, Premier Li Keqiang said in his annual work report on Friday. Chinese leaders announced that the world’s second-largest economy intends to keep consumer price inflation at around 3% and seeks a budget deficit goal of about 3.2% of GDP. The government also aims for an urban unemployment rate of approximately 5.5% and plans to create more than 11 million new urban jobs. In 2020, the country’s GDP expanded 2.3%, the slowest pace in more than four decades.


Friday

Eurozone’s trade surplus widened to €6.3 billion in January from €1.6 billion in the corresponding month of the previous year. Still, it was the smallest trade surplus since last April, linked to the reintroduction of coronavirus restrictions in several European countries. Imports declined 14.1% from a year earlier to a five-month low of €156.8 billion. China was the main partner for the EU due to an increase of exports while imports decreased. Trade with the US recorded a significant drop in both imports and exports.

The Eurozone consumer price index is expected to accelerate to 1.3% y/y in March, the highest level since January 2020 and in line with market expectations, a preliminary estimate showed. Energy prices should rebound 4.3%, compared with a 1.7% drop in February, and services inflation is seen picking up to 1.3% from 1.2%. Meanwhile, cost will probably rise at a slower pace for both non-energy industrial goods and food, alcohol & tobacco. The annual core inflation, which excludes volatile prices of energy, food, alcohol & tobacco and at which the ECB looks in its policy decisions, is expected to slow to 0.9% in March, below market forecasts of 1.1%.

US Housing starts sank 10.3% m/m to an annualized rate of 1.421 million in February, the lowest reading in six months and well below forecasts of 1.56 million. Housing starts reached the highest rate in 14 years in December as people moved away from the big cities due to the coronavirus pandemic. In February, single-family housing starts were at a rate of 1.040 million, 8.5% below January and the rate for units in buildings with five units or more dropped 14.5% to 372,000. Starts fell in the Northeast, the Midwest and the South but rose in the West.

Building permits tumbled 10.8% m/m to a seasonally adjusted annual rate of 1.682 million in February, down from the previous month’s 15-year high of 1.886 million and below market expectations of 1.75 million. Single-family authorizations plunged 10.0% to a rate of 1.143 million while permits for the volatile multi-segment dropped 12.5% to a rate of 539 thousand. Across regions, permits went down in the South, the West, and the Northeast. Meanwhile, building permits in the Midwest rose 1.2% to 249 thousand.

The University of Michigan’s consumer sentiment was revised higher to a one-year high of 84.9 in March of 2021, up from a preliminary estimate of 83 and above market forecasts of 83.6. It was also the largest increase in consumer morale since May 2013, as households welcomed the third disbursement of relief checks and a better than anticipated vaccination progress. Meanwhile, expectations were revised higher to 79.7 from 77.5 and compared to February’s 70.7. The current conditions gauge rose to 93, above a preliminary of 91.5 and up from February’s 86.2. Inflation expectations for the year ahead decreased to 3.1% from 3.3% in the previous month, matching initial figures; while the 5-year outlook rose to 2.8% from 2.7%, above preliminary figures of 2.7%. “The data clearly point toward robust increases in consumer spending.”

Looking Ahead – Fresh Squeezed 2-5-2021

Looking Ahead – Fresh Squeezed


A week ago, when shares of GameStop and other heavily-shorted companies were still soaring and exacting a heavy toll on the hedge funds caught offside, analysts had their heads on a swivel looking around for the next target of the Reddit WallStreetBets short-squeeze mob. The crosshairs locked onto silver, spiking it nearly 15% last Friday morning but, after a half-session head fake, it settled back down, with the CME not waiting long to dial up margin requirements on transactions in the precious metal. Another reason a silver short-squeeze never caught on seemed to be that positioning was not heavily short in the first place, despite what a few posts on Reddit apparently claimed, spurring plenty of dissention in the ranks of fellow Redditors.

In scanning for other areas of heightened investor vulnerability to countertrend price action, plenty of analysts flagged another asset with heavily-concentrated downside positioning that had recently halted its precipitous slide and had been showing signs of incipient reversal. But this was no penny stock or nearly bankrupt retailer but rather an asset that would be particularly insusceptible to even the most concentrated retail speculative energies – the US dollar.


Currency markets are notorious for wrongfooting consensus trades and bearish positioning on the dollar has been as consensus as they come. A fiscal flood + determined Fed dovishness + risk on = dollar weakness, right?

Sentiment on the dollar was similarly dire at the beginning of 2018, but positioning was not even as extreme as it is now, and the dollar refused to break lower for a few choppy months and then surged higher, as US economic outperformance took hold. At the time, gold prices sank and oil prices climbed (a somewhat atypical divergence), while the dollar marched upward in an almost uninterrupted two-month, 7% ascent, while US equities ran higher in tandem.


A similarly dollar- and risk-positive scenario, with US growth diverging to the upside from the G-10, may be emerging this year to upend consensus bearishness on the greenback. After a run of dismal December data amid the seasonal and mutated Covid-19 resurgence, further backsliding in early 2021 seemed like the clear base case, particularly given that that second pandemic relief bill in 2020 was delayed until late in the year. But recent US economic figures have been surprisingly resilient, despite a slight downside miss on January jobs numbers, and even outright strong in the case of housing market metrics and survey-based gauges like purchasing managers’ indexes (PMIs). Meanwhile, the Biden administration has decided that bipartisanship plays a distant second to their intent and urgency to deploy a super-sized pandemic relief package, while vaccine distribution appears to be picking up momentum after a slow start, with 35 million doses now administered and a trend that hits 100 million by mid-April – plus, the vaccines are deemed to be effective against the current set of mutations. And with the Reddit short-squeeze army regrouping in their barracks for now, the abatement of volatility has allowed investors to refocus on the brightening growth outlook.


One key distinguishing factor between the current setup and early 2018 is Fed policy. In 2018, Chair Powell was guiding the policy rate steadily upward, continuing the trajectory of 2017. Now, the FOMC is nearly unanimous in trying to tamp down speculation that they will taper their asset purchase program anytime soon, while “not even thinking about thinking about raising interest rates.” But it seems that the markets are skeptical, as futures continue to reflect expectations for incrementally earlier rate hikes than the Fed is projecting. Economic and market conditions later this year certainly seem aligned to test the Fed’s commitment to their current ultra-dovish formulation in the face of higher inflation and strong growth, which may be pivotal moment for any ongoing dollar rally.


Looking ahead to next week, the focus will be on efforts to pass the American Rescue Act through the narrow straits of the slim Democratic majorities in both houses of Congress. On the data front, US inflation figures will be in the spotlight as market-based gauges of inflation expectations advance to multi-year highs. The impeachment trial of former President Trump is also on the docket. Lastly, next week also features the last major concentration of fourth quarter earnings reports, with Twitter, GM, Coca-Cola, Disney, and Expedia among the most high-profile.


  • US Consumer Price Data
  • Global PMIs
  • Bank of England
  • Reserve Bank of Australia
  • US Initial Jobless Claims


Global Economic Calendar: Price check


Monday

The week begins with German Industrial Production. In November, IP rose 0.9% m/m, following an upwardly revised 3.4% increase in October and above market forecasts of 0.7%. Output increased for intermediate and capital goods, while production of consumer goods decreased 1.7%. It is the 7th consecutive month of rising industrial production although it still was 3.8% lower than in February, the month before the pandemic began.


The evening brings the National Australia Bank’s Index of Business Confidence, which dropped sharply to 4 in December from an upwardly revised 13 in November, reflecting the impact of the Sydney COVID-19 outbreak. Sentiment deteriorated in all industries, except mining, construction, and transport & utilities. Meanwhile, business conditions rose to 14, the highest since September 2018, from 7 in November, with all three sub-indices were above average for the first time since early 2019. Capacity utilization saw further gains and is now around its long-run average and pre-virus levels, while forward orders pulled back but remain in positive territory. “The rise in the employment index is very encouraging and is consistent with the big gains we’ve seen in the official jobs data,” said Alan Oster, NAB Group Chief Economist.


Tuesday

German Balance of Trade kicks off the day. The trade surplus narrowed slightly once again to EUR 17.2 billion in November from EUR 18.5 billion a year earlier. Exports decreased 1.3% to EUR 111.7 billion, the 9th straight annual decline and imports edged down 0.1% to EUR 94.6 billion. Sales to the EU declined 1.7% and those to the Eurozone were down 2.2%. Shipments to China increased 14.3% while those to the US fell 3.1%. Imports from the EU went up 2.6% and those from China 5.4%, while purchases from the US fell 1.5%.


The NFIB Small Business Optimism Index fell to 95.6 in December, the lowest since May and compared to 101.4 in November. This month’s drop is one of the largest as the outlook of sales and business conditions in 2021 deteriorated sizably. Small businesses are concerned about new economic policy in the new administration and a further spread of COVID-19 that is causing renewed government-mandated business closures across the nation.


The Jobs and Labor Turnover Survey (JOLTS), showed the number of job openings in the US declined by 105 thousand to 6.527 million in November, remaining below its pre-pandemic level of 7 million. Job openings decreased in durable goods manufacturing by 48K, information by 45K, and educational services by 21K. The number of job openings was little changed in all four regions. Meanwhile, the number of hires rose by 67K to 6.0 million, while total separations including quits, layoffs and discharges, and other separations jumped by 271K to 5.4 million.


The Consumer Price Index in China closes out the day. In December the CPI rose by 0.2% y/y, after a 0.5% fall a month earlier and compared with market consensus of a 0.1% gain. Food prices increased 1.2%, reversing from a 2.0% fall in November, amid adverse weather and rising demand ahead of the Lunar New Year festival. Pork prices fell less after soaring last year due to the African Swine outbreak. Also, there were rises in cost of health, education, and other goods and services. At the same time, prices of household goods and services were flat for the second straight month, while cost fell for transport, rent, fuel, and utilities, and clothing. On a monthly basis, CPI increased by 0.7%, the most since February, after a 0.6% fall in November. For full 2020, consumer prices rose 2.5%.


Wednesday

Continuing the inflation data this week the day begins with the German consumer price index CPI. In January, the CPI increased 1% y/y, the first rise in seven months, preliminary estimates showed. The temporary reduction in the VAT rate aimed to revive the economy during the coronavirus crisis ended on December 31st. Higher CO2 prices and an increase in minimum wages from January also accounted for the CPI rise. On a monthly basis, inflation increased to 0.8% from 0.5%. The harmonized index went up 1.6% year-on-year and 1.4% month-over-month.


In the US, CPI increased 0.4% m/m in December, higher than 0.2% in November and in line with expectations, mainly driven by an 8.4% increase in the gasoline index, which accounted for more than 60% of the overall increase. The other components of the energy index were mixed, resulting in an increase of 4% for the month. The food index rose 0.4% in December, as both the food at home and the food away from home indexes increased 0.4%. Other increases were also seen for shelter, apparel, and new vehicles. Furthermore, Core CPI, which excludes volatile items such as food and energy, rose 0.1% m/m, following a 0.2% increase in November and matching market expectations.


Wholesale Inventories increased 0.1% m/m in December, following a flat reading in November. Nondurable goods inventories rebounded while durable ones stalled, following a 0.7% rise in October.


The day closes with the Westpac Consumer Confidence Index. Consumer Confidence in Australia decreased to 106.99 points in January from 112 points in December.


Thursday

The focus on a light data day will be US Initial and Continuing Jobless Claims. In the last week of January, 779K Americans filed for unemployment benefits, a significant decrease to from the previous week’s level of 812K, and also well below market expectations of 830K. It marks the third straight week of falls in claims and the lowest amount since the last week of November, however, still far above pre-pandemic levels of around 200K.


Friday

The UK Trade Deficit rose to GBP 5 billion in November from an upwardly revised GBP 2.3 billion in October. It was the largest monthly trade shortfall since April of 2019. Imports surged 8.9% to GBP 55.3 billion, as an 11.9% jump in purchases of goods more than offset a 1.1% decrease in acquisitions of services. Exports rose at a slower 3.9% to GBP 50.3 billion, as goods shipments increased 7.5% while services sales were down 0.3%.


UK Industrial Production edged down 0.1% m/m in November, compared to market forecasts of a 0.5% gain. It is the first decline in industrial output since a record 19.6% plunge in April, as the country was under another lockdown during the month of November to prevent the spread of the coronavirus. The decline was led by falls in mining and quarrying, electricity and gas and water and waste. In contrast, factory output rose 0.7%, led by transport equipment. Production output was 4.7% below February of 2020, the previous month of “normal” trading conditions, prior to the coronavirus pandemic. Year-on-year, industrial output sank 4.7%.


Eurozone Industrial Production rose 2.5% m/m in November 2020, a seventh consecutive month of growth and compared with market expectations of a 0.2% increase. Capital goods output jumped 7.0% and intermediate goods production advanced 1.5%. Meanwhile, output of durable consumer goods, such as televisions and washing machines, dropped 1.2%, after a 1.5% rise in the previous month. Production also fell for both energy and non-durable consumer goods.


The University of Michigan’s Preliminary Consumer Sentiment for February will close out the week. In January the index was revised lower to 79 from a preliminary of 79.2 and below 80.7 in December. There was a decrease in the assessment of current economic conditions, while the expectations component improved slightly. On the price front, both one-year inflation expectations and five-year were unchanged at 3% and 2.5%, respectively. “The overall level of the Sentiment Index has shown only relatively small variations since the pandemic started, averaging 81.5 in 2020, marginally above January’s 79.0. Needless to say, sentiment levels were well below the average of 97.0 from 2017 to 2019. Importantly, the level of key confidence indicators remained well above prior cyclical lows despite the sudden historic collapse in economic activity.”

Looking Ahead – The Dragon and the Ant 11-20-2020

Looking Ahead – The Dragon and the Ant

It has been an eventful few weeks, even by the standards of 2020, which has not lacked for consequential occurrences. As the post-election legal challenges wind down, this unprecedented US political season seems to be heading toward the likely resolution of a grudging (to put it mildly) transition from the Trump administration to the Biden White House, though the actual endgame of the electoral college and physical departure of the incumbent have yet to play out, leaving residual but disquieting tail risks. Meanwhile, initial polls for the Georgia Senate runoffs show that both races are essentially tied, for what that is worth, but we expect markets to grapple with that uncertainty closer to the day of the election. Our base case remains a split decision at best for the Democrats, allowing the GOP to retain control of the Senate, though we expect that the apparent tightness of the races, skepticism in the polls, and the unprecedented political backdrop will force investors to seriously contemplate the possibility that the Dems win back the Senate by running the table on January 5th.

In the meantime, market participants have been weighing the near term Covid-19 autumn/winter nightmare against the encouraging longer-term outlook for widespread distribution of a highly effective vaccine from Pfizer/BioNTech and Moderna, and probably AstraZeneca as well. A focus in financial markets on the heartening prospect of herd immunity being achieved at some point in 2021 predominated for much of last week but the immediacy of the unfolding public health disaster across the US and its economic consequences have dampened the investor mood for much of this week.

The rest of the world has not stood still during all of this, of course, and one of the most consequential recent developments has been the delay of the planned $34 billion Ant Financial IPO on the Shanghai and Hong Kong stock exchanges earlier this month, which was set to eclipse the $29 Saudi Aramco offering as the largest in history. Initial reports citing some regulatory shortcomings did not seem to square with a process that would have surely been so involved and thorough, and with only a matter of days before the offering date of such a high-profile and historical stock market debut. Subsequent reports indicating that President Xi himself had ordered the IPO pulled cemented suspicions that this was no mere regulatory matter and that crossing a few more t’s and dotting a few more i’s on the compliance front would not provide a solution.

What could have been the motive? Clearly Ant Financial’s role in disintermediating the Chinese state-owned banking sector, by competing for deposits and loan business, was obviously one potential consideration. China’s state banks our more than just financial institutions, they are in effect the circulatory system of the state capitalist model and a major wellspring of power for the Chinese Communist Party (CCP). Many of the loans they make are well understood to be on non-commercial terms in the furtherance of policy goals and propagation of often sclerotic state-owned companies and local government funding structures. The fact that Ant Financial was offloading its balance sheet risks on to these lumbering giants while eating off their plate of potential deposits and quality lending opportunities surely had the attention of Beijing. Analysts are speculating that pulling the IPO is in part designed to hamper Ant Financial’s rise while allowing some of the state banks to potentially catch up, and the tighter regulatory standards being applied suggest a meaningful dent in Ant’s profitability advantage.

Meanwhile, Ant Financial’s dominance and sheer size is surely a factor as well. The CCP has always been sensitive to the potential for competing power structures in China, and President Xi’s tenure has featured pronounced assertiveness on this front. While Jack Ma is not Bo Xilai, some major Chinese conglomerates have been taken down in recent years when they fell afoul of the Chinese leadership, with Dalian Wanda and Anbang Insurance being the most prominent examples.

Lastly there is the issue of the digital renminbi. It was always assumed that this innovation, which is putting China out in front of its sovereign competitors in digitizing its currency, would necessarily be competing with WeChat and Alipay, but analysts were unsure the degree to which Beijing was intent on vigorously competing with these popular platforms. This may be a signal that the fight for share of digital payments in China is heating up, with the state looking to capture a meaningful slice, which would not be out of character.

From the US regulatory perspective, this is marvelous news. Beijing is helping make the case that so many policymakers in Washington have pressed recently that Chinese companies are subject to state directives, or even outright agents of Beijing in some cases, routinely fall short of western accounting and disclosure practices, and often feature malign ties to espionage activities. This example will certainly be cited as the new administration carries on the job of attempting to force a higher standard of compliance with accounting rules for Chinese companies listed in the US. This seemingly capricious delay of the Ant Financial IPO is an object lesson that even China’s private sector giants enjoy no enforceable legal protections or property rights in their domestic market, except at the pleasure of President Xi.

Looking ahead, next week’s calendar in the US is dominated by the Thanksgiving holiday, which will occur against the dangerous backdrop of the virulent autumn resurgence of Covid-19, but there will still be plenty of data for analysts to chew on. The preliminary readings of November’s global purchasing managers’ indexes (PMIs) are due, along with US income, spending, and inflation for October.


  • Preliminary Global PMIs for November
  • US Income & Spending
  • US Inflation
  • US Initial Jobless Claims
  • Q3 Corporate Profits


Global Economic Calendar: Thanks(giving) but no thanks(giving)


Monday

This week brings a heavy dose of global manufacturing purchasing managers’ index (PMI) data, beginning with the IHS Markit/BME Germany Manufacturing PMI. The October PMI was revised higher to 58.2 from a preliminary of 58, pointing to the strongest expansion in factory activity since March of 2018. New orders rose at record pace amid stronger demand both domestically and abroad, with rising sales to Asia, specifically China, helping lift new export orders to the greatest extent since December of 2017. As a result, output growth was the third-fastest on record and reflected sharp increases in consumer, intermediate and investment goods. On the other hand, employment fell for the twentieth month. On the price front, average factory gate charges rose modestly and for the first time since May 2019, as stronger demand allowed some goods producers to pass on the burden of higher costs to clients. On the other hand, business confidence slowed slightly from a 32-month high in September, but companies remained positive in general.


Later in the morning the IHS Markit Eurozone Manufacturing PMI for November will be released. October was revised slightly higher to 54.8, from an initial estimate of 54.4 and compared with September’s final 53.7. The latest reading pointed to the steepest month of expansion in the manufacturing sector since July 2018, as output growth accelerated to an over two-and-a-half-year high and new orders rose by the most since the start of 2018.


Next is the IHS Markit/CIPS UK Manufacturing PMI. October was revised higher to 53.7, from a preliminary estimate of 53.3 and compared to September’s final reading of 54.1. The latest number pointed to solid expansion in the UK manufacturing sector, for five months running, with both output and new orders rising amid stronger demand from both domestic and overseas sources. Meanwhile, employment declined for the ninth successive month, and at a faster pace, due to redundancies, recruitment freezes, the non-replacement of leavers, cost reduction strategies and workforce restructuring. On the price front, input cost inflation was the highest since December 2018, while output charges also increased. Looking ahead, business optimism hit the highest level since January 2018 on hopes of economic recovery and a reduction in COVID-19 disruption.


Finally, the IHS Markit US Manufacturing PMI ends the PMI data dump. October was revised higher to 53.4, from a preliminary estimate of 53.3. The reading pointed to the 4th consecutive month of growth in factory activity and the strongest since January of 2019. Output growth was the sharpest since November of 2019, driven by stronger client demand and higher new order inflows. New order growth picked up due to more robust client demand, with some firms noting larger orders being placed. Although domestic demand ticked higher, new export orders fell for the first time since July due to reimposed coronavirus lockdown restrictions in Europe. Reflecting weaker pressure on capacity, firms increased their workforce numbers at a softer pace. Meanwhile, average cost burdens increased at the steepest rate since January of 2019. Business expectations remained positive, improving on September’s 4-month low, as firms foresee a rise in output over the coming year.


The Chicago Fed National Activity Index dropped to +0.27 in September 2020 from an upwardly revised +1.11. Three of the four broad categories of indicators used to construct the index decreased from August. Production-related indicators contributed -0.24 to the CFNAI in September, down from +0.31 in August; and the contribution of the sales, orders, and inventories category to the CFNAI edged down to +0.07 from +0.10. Also, employment-related indicators contributed +0.35 in September, down from +0.71 in August, while the contribution of the personal consumption and housing category to the CFNAI moved up to +0.09 from a neutral value in the previous month.


Tuesday

The day begins with the Final Estimate of German Third Quarter GDP. The previous estimate showed the German economy grew by a record 8.2% q/q, trying to recover from the historic 9.8% slump seen in the second quarter and beating market consensus of 7.3%. The expansion was supported by a rebound in household consumption, strong fixed investment in machinery and equipment and a sharp increase in exports. Year-on-year, the economy shrank by 4.3%, easing from a record contraction of 11.3% in the previous period. The economy was also 4.2% smaller when compared with Q4 2019, the quarter before the coronavirus pandemic hit. Meanwhile, Germany’s government has revised upwards its 2020 GDP forecast. It now expects the economy to shrink by 5.5%, compared to an initial estimate of 5.8% decline, before rebounding by 4.4% in 2021.


Also, in Germany the Ifo Business Climate indicator will be released. October Ifo dropped to 92.7, from a seven-month high of 93.2 in September. Companies were considerably more skeptical regarding developments over the coming months following the imposition of tougher restriction measures to curb the spread of the COVID-19 pandemic. In contrast, firms assessed their current situation as better than in the previous month.


In the US, the Conference Board Consumer Confidence Index will be the focus of the day. In October, the index declined slightly, after increasing sharply in September. The Index now stands at 100.9, down from 101.3 in September. The Present Situation Index, based on consumers’ assessment of current business and labor market conditions, increased from 98.9 to 104.6. However, the Expectations Index, based on consumers’ short-term outlook for income, business, and labor market conditions, decreased from 102.9 in September to 98.4.


Wednesday

The day opens with the Second Estimate of US GDP. The first estimate showed the US economy expanded by an annualized 33.1% in Q3 2020, the biggest expansion ever, following a record 31.4% plunge in Q2. Personal spending surged and was the main driver of growth, helped by checks and weekly unemployment benefits from the federal CARES Act. Growth also reflects increases in private inventory investment, exports, nonresidential fixed investment, and residential fixed investment that were partly offset by decreases in federal government spending, reflecting fewer fees paid to administer the Paycheck Protection Program loans.


The day also will digest US Durable Goods Orders. In September, new orders surged 1.9% m/m, well above a 0.4% rise in August. Orders rose for the 5th straight month, led by transport equipment, as the economy recovers from big plunges in March and April due to the coronavirus pandemic. Orders rebounded for transportation equipment, namely motor vehicles, and fabricated metal products, and continued to rise for capital goods, and computers and electronics. On the other hand, orders fell for machinery, and electrical equipment, appliances and components. Orders for non-defense capital goods excluding aircraft, a closely watched proxy for business spending plans, increased 1%, following an upwardly revised 2.1% rise in August.


Third Quarter US Corporate Profits come next. In Q2, corporate profits tumbled by 10.7% to an over four-year low of $1.59 tril. It was the sharpest decline in corporate profits since the last quarter of 2008, amid the coronavirus crisis. Undistributed profits slumped by 43.8% to $230 bil and net cash flow with inventory valuation adjustment, the internal funds available to corporations for investment, dropped by 9.5% to $2.10 tril. Also, net dividends were 1.1% lower at $1.36 tril.


Weekly Initial and Continuing Jobless Claims. The number of initial claims for state unemployment benefits rose by 742K in the week ending November 14th, surpassing market forecasts of 707K, and registered as the fifth consecutive week that claims remained in the 700K’s territory. The reading climbed by 31K from the prior report’s revised level of 711K and was the first rise in claims in over a month amid a resurgence in coronavirus cases and targeted lockdowns across the country. Continuing claims fell by 429K to 6.37 million in the week ending November 7th, slipping below market forecasts of 6.47 million, and marked the lowest total since the pandemic-induced turmoil in March. The increase in initial claims was most severe in Louisiana, where filings more than quadrupled to 42K. Massachusetts, Texas, and Virginia also saw notable increases, while Illinois, Florida, New Jersey, and Washington saw the greatest declines. Although total state claims have fallen, the number of Americans claiming extended non-state benefits is continuing to rise. For the week ending November 14th, the Pandemic Unemployment Assistance (PUA) reading rose by 320K. The Pandemic Emergency Unemployment Compensation (PEUC) program, which provides an additional 13 weeks of support, added 233K claims in the week ending October 31st, summing to nearly 4.4 million Americans receiving extended aid through the program. The total persons claiming unemployment benefits including non-state programs fell by 841K to 20.3 million ending the same period.


The Personal Income and Spending Report comes later in the morning. In September, personal income rose by 0.9% m/m, rebounding from a revised 2.5% slump in August. The monthly gain was boosted by increases in proprietors’ income, compensation of employees, and rental income of persons, which were partly offset by a decrease in government social benefits. Personal spending increased 1.4%m/m, following a 1% rise in August. Real spending went up by 1.2% or $159.2 bil, reflecting an increase of $109.9 bil in spending for goods and a $61.0 bil rise in spending for services. Within goods, clothing and footwear as well as motor vehicles and parts were the leading contributors to the gain. Within services, the largest contributors were spending for health care as well as recreation services, led by membership clubs, sports centers, parks, theaters, and museums.


The report also contains the Personal Consumption Expenditure (PCE) Price Index. Headline PCE rose 0.2% m/m in September, following a 0.3% gain in August, boosted by an increase in services cost, while goods prices fell 0.1%, led by a 0.3% drop in nondurable goods. Core PCE, which excludes food and energy and which the Fed has a 2% target, rose 0.2%, in line with market expectations. Year-on-year, Headline PCE advanced 1.4% and Core increased 1.5%.


New Home Sales follows as sales dropped 3.5% m/m to a SAAR of 959K in September, from the previous month’s 14-year high of 994K. The level of home sales remained elevated as the housing market has been supported by record low interest rates and increasing demand from people moving away from big cities due to the coronavirus crisis. In September, new home sales declined 4.7% to 563K in the South, 4.1% to 93K in the Midwest and 28.9% to 32K in the Northeast but rose 0.7% to 284K in the West.


The day closes with Final Estimate of the University of Michigan’s Consumer Sentiment. The preliminary estimate decreased to 77 in November from 81.8 in October and against market expectations of 82. It is the lowest reading since August as consumers judged future economic prospects less favorably, 71.3 vs 79.2 in October, while their assessments of current economic conditions remained largely unchanged. Meanwhile, inflation expectations for the year ahead increased to 2.8% from 2.6% and the 5-year outlook to 2.6% from 2.4%. The outcome of the presidential election as well as the resurgence in COVID-19 infections and deaths were responsible for the early November decline. Interviews conducted following the election recorded a substantial negative shift in Republicans’ expectations and no gain among Democrats.


Thursday

The focus of Thursday will be the GfK Consumer Climate Indicator in Germany. The index fell to -3.1 heading into November from a revised -1.7 in October. This was the weakest reading since July, amid fears over another lockdown following a resurgence of COVID-19 cases in the country. The gauge for economic outlook tumbled 17 points to 7.1, the income expectations sub-index fell 6.3 points to 9.8, and the willingness to buy indicator dropped 1.4 points to 37. GfK consumer expert Rolf Buerkl said, “Consumers apparently assume that the much more active infection process in Germany will slow down the previously hoped for rapid recovery of the German economy.”


Friday

The week closes with the Eurozone Economic Sentiment Indicator for November. In October, the indicator was unchanged at 90.9but remaining well below pre-pandemic levels, as rising COVID-19 cases across the region forced many European governments to impose fresh restrictive measures. By sector, confidence deteriorated among service providers and consumers, while morale improved among manufacturers, retailers and constructors.