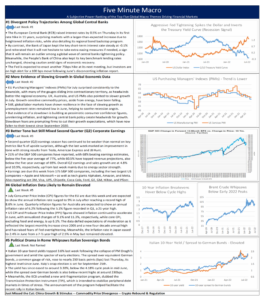
Divergent central bank policies remain as the driving factor in markets as economic data continues to muddle the outlook. Global inflation remains elevated, but macro headwinds in China and nuanced corporate earnings join the list.
Divergent central bank policies remain as the driving factor in markets as economic data continues to muddle the outlook. Global inflation remains elevated, but macro headwinds in China and nuanced corporate earnings join the list.
Looking Ahead – ‘23 and Me
As we noted last week, our base case for topping inflation and slowing (but not crashing) growth with a downshifting Fed is the recipe for the second half 2022 rally. This week’s tantalizing bounce has us temped to upgrade stocks earlier than we feel comfortable doing – financial markets have a way of forcing investors into uncomfortable decisions, of course. Still, we are holding our neutral posture for now on US stocks, especially with some banana peels possible amid next week’s gauntlet of mega IT earnings, plus a pivotal Fed decision, but upcoming dips will look increasingly buyable for the more extended second half rally we anticipate.
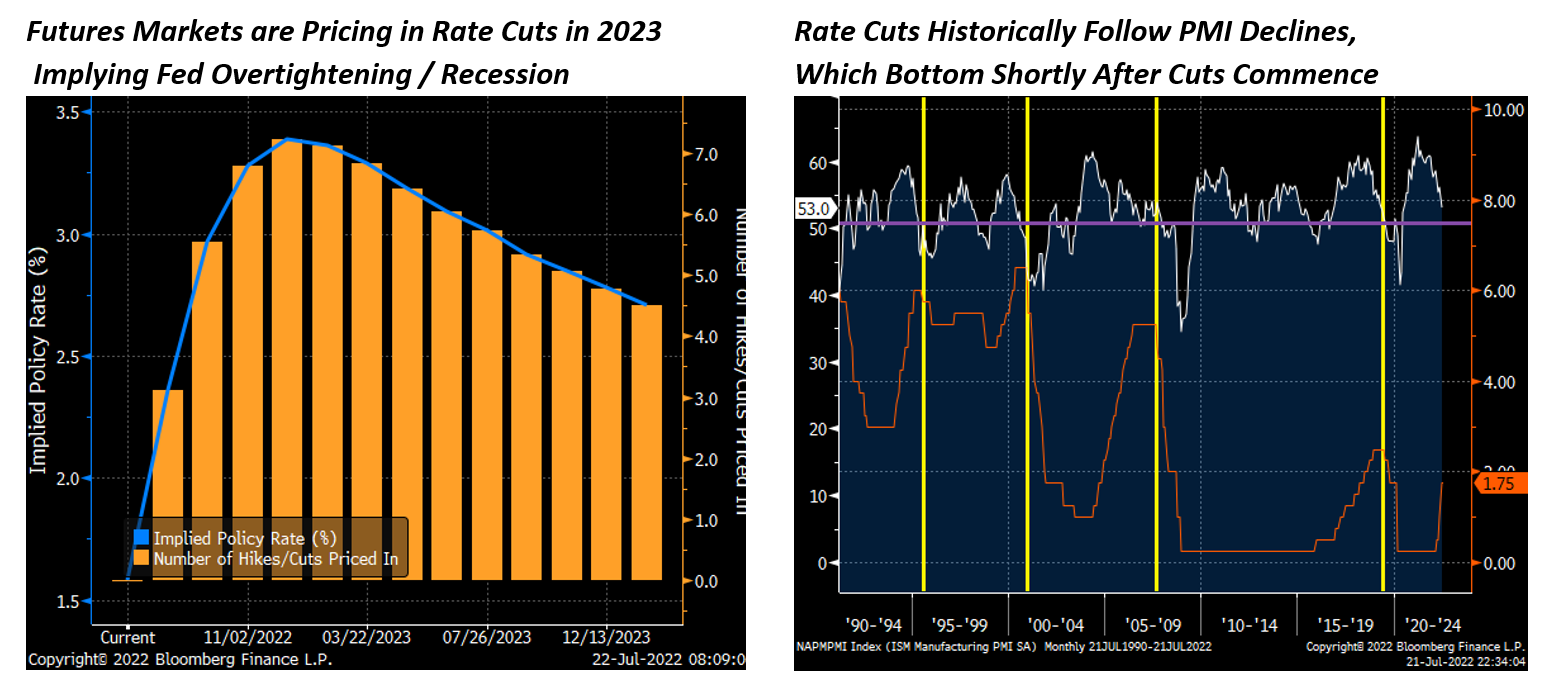
If this is an ordinary market cycle, then we would probably further assume that the bottom of this bear market is nearly in place after a few more months of pain. And this is essentially what futures markets are suggesting, with the hiking cycle seen topping at year end 2022 and interest rate cuts commencing gradually in spring/summer of 2023 (see the chart on the left below). This would follow the historical pattern of sliding growth (with manufacturing PMI as the growth proxy in the chart at right below) eliciting rate cuts which, shortly thereafter, help lift growth from its lows. Stocks anticipate this and would start to rally later this year as the Fed puts its last rate hike on the board.
However, our view is that inflation will come down but stay sticky, with the housing component remaining elevated and persistently lofty energy prices keeping the Fed on alert for a rebound in price pressures lest they ease prematurely. With economists and commentators like Larry Summers breathing down their necks, and the narrative about the high costs of the “stop/start” 70’s monetary policy approach shaping their reaction function, plus the standard “once bitten, twice shy” dynamic, we expect that the bar for rate cuts in 2023 will be very high. Also, on the political front, the Democrats will also be blaming midterm outcomes on inflation and will be favorably inclined to the Fed prioritizing inflation suppression over growth support, which is not a negligible factor in our view.
We think this formulation will make for a challenging 2023 for risk assets, as the assumption of rate cuts and easing evaporate despite continued or worsening weakness in growth. It is worth noting that Fed tightening does hit the economy with a lag and we expect the headwinds from persistently high energy prices to exert durable and non-linear pressure on consumers. In short, the consensus view is things get worse before they get better, while we expect things to get better in the second half of 2022 and relapse.
Looking ahead, the main event on next week’s macro calendar is the July Fed meeting, with analysts expecting a 75bps hike after speculators toyed with the idea of 100bps after the hotter than expected June Consumer Price Index reading earlier this month. On the data front, the initial reading of Q2 US GDP will be in focus as economists project a modest expansion. EU GDP readings are also due, along with inflation figures for the bloc, while Japan also releases its CPI data along with retail sales and industrial production. Earnings reporting season heats up with a heavy concentration of mega-cap IT companies reporting figures, including Google, Microsoft, Apple, Amazon, and Facebook. Also reporting are 3M, Visa, UPS, Chipotle, Coca-Cola, Ford, GE, GM, Hilton, Mastercard, Pfizer, and Procter & Gamble.
Global Economic Calendar: Fed Dead Ahead
Monday
The Ifo Business Climate indicator for Germany fell to 92.3 in June from a 3-month high of 93 in May, falling short of market expectations of 92.9 as concerns over the threat of gas shortages caused the subindexes for both current conditions (99.3 vs 99.6 in May) and expectations (85.8 vs 86.9) to deteriorate. By sector, sentiment weakened in manufacturing, chemicals, and especially trade, which saw its expectations index fall to its lowest level since April 2020. Wholesalers and retailers also expressed pessimism about the second half of the year. On the upside, the service and construction sectors notched improvements in both their assessments of the current business situation as well as their expectations for the coming months, although many companies remain tangibly pessimistic.
The Chicago Fed National Activity Index dropped to an eight-month low of +0.01 in May from +0.40 in April, with production-related indicators contributing -0.01 (down from 0.29 in April) and the personal consumption and housing category falling to -0.11 from +0.10 in the previous month. By contrast, employment-related indicators contributed +0.08, up slightly from +0.07, and the contribution of the sales, orders, and inventories category jumped to +0.05 in May from -0.07. The index’s three-month moving average, CFNAI-MA3, decreased to +0.27 from +0.39, suggesting that the economy is still expanding, albeit at a slower rate compared to previous months.
Tuesday
The S&P CoreLogic Case-Shiller 20-city home price index in the US increased 21.2% year-over-year in April, a new record high, above market forecasts of 21% and following a downwardly revised 21.1% increase in March. Figures showed once again that the housing market remained strong heading into Q2, with Tampa (35.8%), Miami (33.3%), and Phoenix (31.3%) remaining the cities with the strongest price gains in the last year. However, the national index eased to 20.4% from 20.6% in March. “April 2022 showed initial (although inconsistent) signs of a deceleration in the growth rate of U.S. home prices. We continue to observe very broad strength in the housing market and a more-challenging macroeconomic environment may not support extraordinary home price growth for much longer,” said Craig J. Lazzara, Managing Director at S&P DJI.
New home sales in the US rose 10.7% from a month earlier to a seasonally adjusted annual rate of 696,000 in May, beating market expectations of 588,000. Increases were seen in home sales in the West (39.3% to 202,000) and South (12.8% to 413,000), while sales continued to decline in the Northeast (-51.1% to 23,000) and Midwest (-18.3% to 58,000). Meanwhile, the median sales price of new houses sold was $449,000, down slightly from the previous month but still much higher than $390,400 a year earlier, while the average sales price was $511,400, down from $569,500 in April.
The annual inflation rate in Australia surged to 5.1% in Q1 2022 from 3.5% in Q4, topping market estimates of 4.6% and marking the strongest quarterly inflation since the introduction of the Goods and Services Tax in July 2000 as soaring fuel prices and building costs boosted the overall rate. Main upward pressure came from transport prices, which rose the most since the Iraqi invasion of Kuwait in 1990 (13.7% vs 12.% in Q4); while price increases in food and non-alcoholic beverages (4.3% vs 1.9%), alcohol and tobacco (1.8% vs 1.1%), housing (6.7% vs 4%), recreation (3% vs 2.1%), health (3.5% vs 3.3%), and insurance and financial services (2.7% vs 2.2%) also accelerated. On a quarterly basis, consumer prices went up 2.1%, the most since Q3 2000 and following a 1.3% gain in Q4, mainly due to a jump in the cost of new dwellings and fuel. The RBA Trimmed Mean CPI went up 3.7% y/y, the most in 12 years, exceeding the midpoint of the central bank’s 2-3% target for the second consecutive quarter. Quarter-on-quarter, the index increased 1.4% following a 1% rise in Q4.
Wednesday
The GfK Consumer Climate Indicator in Germany sank to a record low of -27.4 heading into July from an upwardly revised -26.2 in June, slightly above market forecasts of -27.7. All of the main subindexes weakened as high inflation and recession fears weighed heavily on consumers, with economic expectations falling to -11.7 from -9.3, income expectations dropping to a near-20-year low of -33.5 from -23.7, and the propensity to buy sinking to -13.7 from -11.1. “The ongoing war in Ukraine and disrupted supply chains are causing energy and food prices in particular to explode and making the consumer climate more gloomy than ever,” said Rolf Bürkl, GfK consumer expert.
US Durable Goods Orders increased 0.7% month-over-month to $267.2 billion in May, following a 0.4% rise in April and beating forecasts of a 0.1% rise, in a sign that business spending plans remained strong despite higher interest rates and elevated inflation. Orders increased for transportation equipment (0.8%), capital goods (0.8%), machinery (1.1%), and computers and electronics (0.5%), while orders for non-defense capital goods excluding aircraft, a closely watched proxy for business spending plans, edged up 0.5%, up from 0.3% in April.
Pending home sales in the US unexpectedly rose 0.7% month-over-month in May, the first rise in seven months and following a 4% decline in April. Figures came well above market forecasts of a 3.7% fall. By region, signings increased in the Northeast (15.4%) and South (0.2%), while the Midwest (-1.7%) and West (-5%) experienced declines. However, despite the gain in May, soaring mortgage rates and low supply were expected to continue to weigh on the housing market, with the NAR estimating that at the median single-family home price and with a 10% down payment, monthly mortgage payments have increased by about $800 since the start of the year as mortgage rates have climbed 2.5% since January. “Despite the small gain in pending sales from the prior month, the housing market is clearly undergoing a transition. Contract signings are down sizably from a year ago because of much higher mortgage rates,” said Lawrence Yun, Chief Economist at the National Association of Realtors. Year-on-year, pending home sales plunged 13.6%.
The Federal Reserve’s Open Market Committee will convene next Tuesday, where it is expected to once again raise interest rates by 75 bps as inflation continues to rage, although some are forecasting an even more aggressive 100 bps hike after June CPI data showed prices increased 9.1% year-on-year, the highest reading since November 1981. At its last meeting in June, the Committee raised the target for the federal funds rate by 75 bps to 1.5%-1.75%, marking the third consecutive rate increase and the largest hike since 1994. Fed Chair Jerome Powell has stated that the Fed remains committed to doing whatever it takes to restore price stability, although other Fed policymakers including Atlanta Fed President Raphael Bostic and St. Louis Fed President James Bullard have downplayed or, in the case of Bostic, outright cautioned against a dramatic 100 bps hike. The Fed is currently projected to bring the federal funds rate to around 3.5% by year’s end.
Thursday
The annual inflation rate in Germany was confirmed at 7.6% in June, slowing from 7.9% in the previous month, which was the highest reading since the German reunification in 1990, as a controversial fuel price rebate designed to cushion the impact of the conflict in Ukraine on consumers had a slight downward effect on overall inflation. Energy prices rose at a softer 38% year-over-year, compared to 38.3% in May, while food price inflation accelerated to 12.7%, the highest rate since at least 1992 and up from 11.1% in May. The price of energy products increased sharply, especially for heating oil (108.5%), motor fuels (33.2%), and natural gas (60.7%), reflecting the impact of Russia’s invasion of Ukraine. Meanwhile, inflation in the cost of services eased to 2.1% from 2.9%, with rent prices up 1.7%. On a monthly basis, consumer prices rose 0.1%, the least in seven months and down from 0.9% growth in May. The CPI, harmonized to compare with other European countries, was up 8.2% on the year but edged down 0.1% month-on-month, which was the first decline since November 2020.
The US economy (GDP) contracted an annualized 1.6% on quarter in the first three months of 2022, slightly worse than the previous estimate of a 1.5% decline and marking the first quarterly contraction since the onset of the pandemic in 2020 as record trade deficits, supply constraints, worker shortages, and high inflation weighed on growth. Imports surged more than anticipated (18.9% vs 18.3% in the second estimate), led by nonfood and nonautomotive consumer goods, while exports dropped less than previously estimated (-4.8% vs -5.4%). Also, consumer spending growth was revised lower (1.8% vs 3.1%) as increased spending on services, especially housing and utilities, was partially offset by decreased spending on goods, namely groceries and gasoline. In addition, private inventories subtracted 0.35 percentage points from growth, much less than the 1.09 percentage point drag reported in the second estimate. Fixed investment growth remained robust (7.4%), although housing investment was subdued (0.4%).
Japan’s unemployment rate rose to 2.6% in May from 2.5% in April, slightly above market expectations of 2.5%. The number of unemployed increased by 40,000 to 1.8 million, while employment decreased by 140,000 to 69.04 million and those detached from the labor force fell by 40,000 to 41.13 million. The non-seasonally adjusted labor force participation rate edged up to 62.7% from 62.5% in May 2021. Meanwhile, the jobs-to-applications ratio reached a 25-month high of 1.24 in May from 1.23 in April, in line with forecasts.
Friday
The consumer confidence index in Japan fell to an 18-month low of 32.1 in June from 34.1 in the previous month amid ongoing global uncertainty. All subindexes weakened, with employment perceptions down 1.6 points from a month earlier to 37.4, overall livelihood down 2.6 points to 29.8, views toward income growth down 1.4 points to 35.8), and willingness to buy durable goods down 2.6 points to 25.3.
The German economy (GDP) expanded by 0.2% on quarter in the first three months of 2022, recovering from a 0.3% fall in Q4 2021 and in line with preliminary estimates. Growth was mainly supported by a rebound in capital formation (2.7% vs 0% in Q4) as construction investment bounced back and machinery and equipment investment increased, while government spending rose 0.1% (vs 0.2% in Q4). Household expenditure was down 0.1%, an improvement from the 1.3% contraction in Q4, while net exports also had a downward effect on the economy as exports fell 2.1% (vs a 3.8% rise) and imports continued to rise, albeit at a slower pace than in the previous quarter (0.9% vs 4.1%). On a yearly basis, the economy grew 3.8%, which was the fastest yearly growth in three quarters.
The Eurozone economy (GDP) expanded 0.6% on quarter in the first three months of 2022, up from previous estimates of 0.3% and above a downwardly revised 0.2% gain in Q4 2021 as net trade and inventories helped boost overall output. Exports rose 0.4% compared to a 0.6% decline in imports, while gross fixed capital formation rose just 0.1%. Meanwhile, household consumption sank 0.7% and public expenditure contracted 0.3%. Compared with the same period last year, the Eurozone economy advanced 5.4%. Still, the economy was expected to face headwinds from the war in Ukraine and related supply disruptions and uncertainty. The European Central Bank (ECB) also ended an eight-year period of negative interest rates yesterday, which is likely to drag consumer spending and investment in the coming months.
The annual inflation rate in the Eurozone was confirmed at a record high of 8.6% in June, compared to 8.1% in May and 1.9% a year earlier. Prices increased across the board, with energy once again making the largest contribution (42% vs 39.1% in May) and food, alcohol & tobacco (8.9% vs 7.5%), services (3.4% vs 3.5%), and non-energy industrial goods (4.3% vs 4.2%) also showing sustained inflation. Excluding energy, the inflation rate increased to 4.9% from 4.6% in the previous month, well above the ECB’s target of 2%. Month-over-month, prices increased 0.8%.
Personal spending in the US increased 0.2% month-over-month in May, the weakest gain so far this year and following a downwardly revised 0.6% rise in April. Figures fell short of market forecasts of 0.4%. Still, spending rose for international travel and hospital services, gasoline, and services, namely housing, although spending on motor vehicles and parts, especially new autos, declined. Adjusted for changes in prices, purchases of goods and services fell 0.4%, marking the first drop this year as high inflation weighs on affordability.
Personal income in the US went up 0.5% from a month earlier in May, the same as in the previous month and matching market expectations as an increase in compensation and proprietors’ income offset a decrease in government social benefits. Within compensation, the increase reflected increases in both private and government wages and salaries. The increase in proprietors’ income was led by nonfarm income, while the fall in government social benefits reflected a decrease in transfers to nonprofit healthcare providers through the Provider Relief Fund, although the decrease was partially offset by increases in Medicaid and Medicare payments.
The personal consumption expenditure price index increased 0.6% month-over-month in May, up from a 0.2% rise in April. Still, the annual rate remained at 6.3% after reaching a record high of 6.6% in March. Energy prices increased 35.8%, up from 30.4% in April, although food inflation quickened once again to 11% from 10%. Core PCE, which excludes food and energy, rose 4.7% from one year ago, easing from 4.9% in April and below forecasts of 4.8%.
Summary and Price Action Rundown
US equities retraced a modest bit of their recent rally as investors digested more Fed commentary and signs of intensifying growth fears in Treasury markets, while oil prices slid amid rising demand fears. The S&P 500 declined 0.3% today, deepening the index’s year-to-date loss to 13.6%, while the Nasdaq also edged lower, taking its 2022 performance to -20.9%. Overseas, the Euro Stoxx Index closed flat, while Asian stocks were mostly higher overnight. Longer-dated Treasuries extended their rally, with the 10-year yield dropping to 2.58%, the lowest level since April, while the growth-sensitive 2/10 yield curve deepened its inversion, continuing to convey a classic recession signal. The broad dollar continued to retreat below last month’s cycle high, which was its strongest level in twenty years. Oil prices were hit by demand fears ahead of this week’s OPEC+ meeting, with Brent crude sinking below $100 per barrel. – MPP upgraded US equities / downgraded the dollar: Our base case for topping inflation and slowing (but not crashing) growth with a downshifting Fed is the recipe for a second half 2022 tradable risk asset rally. With this past week’s developments increasingly aligning with this view, **we are upgrading stocks from neutral to 70% overweight and downgrading the dollar to a tactical sell, though we are still neutral on the Treasury market and curve. ** We still believe that summer markets will be choppy, and we just had a very positive week and a meaningful July rally, hence we are leaving some headroom to go further overweight if upside catalysts, like peaking CPI figures, materialize between now and the September FOMC decision.
Recession Warning from the Treasury Market Grows Louder
Longer-dated Treasury yields extended lower today, further inverting the yield curve as investors weighed the prospects of a recession and the path for future Fed rate hikes. While Fed Chair Powell said last week that the pace of rate increases could slow “at some point,” hawkish comments from Minneapolis Fed President Neel Kashkari on Sunday indicated that the economy still has a long way to go before inflation comes down to the bank’s target of 2%. Kashkari said the central bank will do whatever is necessary to bring inflation down, even if it leads to a recession, although they will try to avoid it. “Whether we are technically in a recession or not doesn’t change the fact that the Federal Reserve has its own work to do, and we are committed to doing it,” he said. Kashkari’s comments imply that he is willing to continue supporting an aggressive path for rate hikes, which also raises the likelihood of the Fed overtightening and inducing a recession. The 10-year Treasury yield fell to 2.58% today, as investors likely reacted in part to the hawkish stance from the Fed official in addition to the ISM manufacturing data for July that showed a bigger-than-expected drop in the prices paid component. Bank of America analysts believe that the 10-year yield could reach 2% in the next 6-12 months amid a “globally synchronized slowdown” that could exacerbate demand for US Treasuries. Meanwhile, the policy-sensitive 2-year Treasury yield fluctuated on Monday and finished roughly flat at 2.89%. The inverted 2-year/10-year yield curve, which is a classic signal of an impending recession, reached its most extreme negativity in decades of -0.32 at one point. – MPP view: While we are sympathetic to the view that the global synchronized slowdown will keep longer-dated Treasury yields capped, we think there is only so much downside possible given our expectation that the Fed will ease off its rate hike trajectory and help re-steepen the yield curve to some degree. This push-pull dynamic is behind our reasoning for staying neutral on Treasury markets at these levels (for context, we turned neutral on Treasuries in mid-May, which has been insufficiently bullish).
Increasing Signs of Deterioration in US Housing Market Metrics
Rising mortgage rates and inflation in the broader economy caused housing demand to drop sharply in June, forcing home prices to cool down. Home prices are still higher than they were a year ago, but the gains slowed faster in June, according to Black Knight, a mortgage software, data, and analytics firm that began tracking this metric in the early 1970s. The annual rate of price appreciation fell from 19.3% to 17.3%. Price gains are still substantial because of an imbalance between supply and demand. The housing market has had a severe shortage for years. Strong demand during the coronavirus pandemic exacerbated it.
Prices are not expected to fall nationally, given a stronger overall housing market, but higher mortgage rates are taking their toll. According to Mortgage News Daily, the average rate on the 30-year fixed mortgage crossed over 6% in June. It has since dropped back to the lower 5% range, but that is still significantly higher than the 3% range rates at the start of this year. “25% of major U.S. markets saw growth slow by three percentage points in June, with four decelerating by four or more points in that month alone,” said Ben Graboske, president of Black Knight Data & Analytics. Still, while this was the sharpest cooling nationally, the market would have to see six more months of this deceleration for price growth to return to long-run averages, according to Graboske. He calculates that it takes about five months for interest rate impacts to be fully reflected in home prices. So far, markets seeing the sharpest drops are those that previously had the highest prices in the nation. Average home values in San Jose, California, have fallen 5.1% in the last two months, the biggest drop of any of the top markets. That chopped $75,000 off the price. Seattle, San Francisco, San Diego, and Denver round out the top five markets with the most significant price reductions.
The cooling in prices coincides with a sharp jump in the supply of homes for sale, up 22% over the last two months, according to Black Knight. Inventory is still, however, 54% lower than 2017-19 levels. Price drops will not affect the average homeowner as much as they did during the Great Recession because homeowners today have considerably more equity. Tight underwriting and several years of strong price appreciation caused home equity levels to hit record highs. – MPP view: As we have noted, increasingly manifest weakness in US economic indicators and housing data is a necessary condition for the Fed downshift, making bad news (though not too bad) on the growth front good news on the monetary outlook. In short, the new Goldilocks macro formulation is “weak but not too weak,” which we think will be the story of the second half of this year. This data only generally fits this Goldilocks formulation, and we think more economic readings will fall into this Goldilocks category over the current quarter and into Q4.
Additional Themes
Crude Hit by Demand Fears – Oil prices fell sharply on Monday, as poor manufacturing data from key markets trigger demand concerns. Specifically, the latest manufacturing datapoints from China and Japan both indicated a slowdown in economic expansion. China’s Caixin/Markit PMI index dropped to 50.4 in July from 51.7 in June, well below market forecasts of 51.5. Japan’s Jibun Bank PMI index decreased slightly to 52.1 in July from 52.7 in the previous month. Japan’s slowdown in manufacturing activity was mainly caused by inflation and supply chain disruptions; China’s weak factory data was mainly due to domestic Covid-19 lockdowns. Other key markets, such as South Korea and some members of the Euro Area, also reported discouraging manufacturing numbers. Not only do global PMI results drag oil prices down, but recessionary pressures from major economies are also making oil prices drop. The US economy shrank for a second quarter, which is traditionally a key indication of an economic recession. Additionally, a rise in Libyan oil production has also helped drive oil prices down. The North African nation is now producing 1.2 million barrels per day, up from 800,000 bpd on 22 July, after the lifting of a blockade on several oil facilities. Furthermore, the amount of rigs in the US was also climbing to help increase US oil production. Meanwhile, OPEC+ will meet on Wednesday to determine the output target for September. Output policy is likely going to remain unchanged, although US President Biden called for more production during his trip to Saudi Arabia. Currently, the OPEC+ group is actually almost 3 million bpd short of its quotas due to sanctions and a lack of investment. OPEC’s new secretary general, Haitham al-Ghais, said during an interview ahead of Wednesday’s meeting that “OPEC doesn’t control oil prices, but it practices what is called tuning the markets in terms of supply and demand.” – MPP view: Our view is that slowing growth and correspondingly weakening demand for crude will cap Brent/WTI upside but not result in significant price relief. We have seen pre-OPEC+ declines in crude oil quickly priced out after the meeting and we doubt this week will be any different. Persistently elevated oil prices despite other disinflationary impulses will allow a Fed downshift in its tightening cycle and a peak in rates by year-end but, further out, will keep the bar very high for FOMC rate cuts, even as growth continues to deteriorate in 2023, which we think is the recipe for a rebound for risk assets in 2H2022 and relapse to the downside in 1H2023.
Concerns Surround Speaker Pelosi’s Planned Taiwan Visit – House Speaker Nancy Pelosi arrived in Singapore today, where she is set to kick off a planned tour of Asia that has raised tensions between Washington and Beijing over reports that it will include a stop in Taiwan despite increasingly sharp warnings from Chinese authorities that a visit to the island could provoke a military response. The People’s Liberation Army “won’t sit idly by,” said Chinese Foreign Ministry Spokesman Zhao Lijian in a regular press conference last Friday. “Her stature as the No. 3 US official means a trip would be highly sensitive… As to what measures, let’s wait and see whether she insists on this visit.” For context, Speaker Pelosi’s official trip itinerary made no specific mention of Taiwan, but reports from CNN and Taiwanese media outlets citing both US and Taiwanese officials say that she is planning to meet with Taiwanese President Tsai Ing-wen on Wednesday and that several hotels in downtown Taipei had been booked in advance of her arrival. The Biden administration has reportedly voiced some opposition to the trip, but aides said the President is declining to directly ask Pelosi to cancel the visit out of respect for the independence of Congress.
In response to the Chinese threats, US officials have cautioned China against escalating the situation. “There is no reason for Beijing to turn a potential visit consistent with longstanding US policy into some sort of crisis or use it as a pretext to increase aggressive military activity in or around the Taiwan Strait,” said Pentagon spokesman John F. Kirby at a White House briefing. “Our actions are not threatening and they break no new ground. Nothing about this potential visit — potential visit — which by the way has precedent, would change the status quo.” American officials are reportedly betting that China will not risk a direct confrontation by interfering with Speaker Pelosi’s ability to land safely on the island, but they say that Chinese planes may “escort” her Air Force plane as a demonstration of their control over air routes, and yesterday, a spokesman for the Chinese air force said the country’s fighter jets would fly around the island to showcase its ability to defend what Beijing considers to be Chinese territory, although he did not specify dates for the exercise. “The Chinese side has repeatedly made clear to the US side our serious concern over Speaker Pelosi’s potential visit to Taiwan and our firm opposition to the visit,” Zhao said. “If the US side challenges China’s red line, it will be met with resolute countermeasures. The US must bear all consequences arising thereof.” The New Taiwan dollar fell to a two-year low on the news. – MPP view: This seems like an unfavorable risk/reward for the Speaker’s trip, and presents a “small probability but potentially major impact” event that is basically impossible to hedge.
Latest Macrocast: Breaking Down the Fed’s Big Week with Howard Schneider – On today’s Macrocast, Tony, John, and Brendan welcome Howard Schneider, Federal Reserve reporter at Thomson Reuters, to the show. As an expert on all things Fed and monetary policy, Howard breaks down the Fed’s latest rate hike and inflation’s impact on food consumption. Plus, the group analyzes the concerning PCE and GDP data released this week. Tune in here! https://marketspolicy.com/podcast-2/
Read Howard Schneider’s recent piece on food prices and rising hunger here.
Find more of Howard’s work here.
Read HPS’ Q2 GDP Fact Sheet here.
Macrocast Special: A Conversation with Megan Greene on the Anti-Inflation Toolkit – In this special edition of the Macrocast, Tony and John welcome Megan Greene, Harvard Kennedy School Senior Fellow and Kroll Institute Global Chief Economist, to the show. Megan expands on her recent column in the Financial Times, where she makes an important point few pundits have acknowledged: There’s not much policymakers outside the Federal Reserve can do about inflation. The group walks through various policy responses to inflation and the supply- and demand-driven forces behind rising prices. Plus, the group discusses energy prices, the methodology for measuring inflation, and more. Tune in here! https://marketspolicy.com/podcast-2/
Read Megan’s Financial Times column here.
Read the rest of Megan’s FT columns here.
Read Megan’s bio and check out her site here.
Looking Ahead – Next week’s macro calendar features the US nonfarm payroll figures for July, which is expected to reflect continued resilience in the US labor market with 250k jobs and steady unemployment at 3.6%. Other notable data includes global Purchasing Managers’ Indexes (PMIs), EU and Australian retail sales, German factory orders and industrial production, and Turkish inflation figures. The Bank of England and Reserve Bank of Australia have decisions. OPEC+ conducts its monthly meeting on supply curbs and earnings reporting season continues with results from Aflac, Caterpillar, Cigna, ConocoPhillips, CVS Health, Electronic Arts, Eli Lily, Lyft, Marathon Petroleum, Marriott, MetLife, PayPal, Prudential, Starbucks, and Yum! Brands.
Summary and Price Action Rundown
Global risk assets are mixed this morning as the ongoing US stock rally pauses to digest Fed communications ahead of more consequential earnings this week. S&P 500 futures are indicating a 0.2% lower open after the index rose 4.3% last week, building on monthly gains and bringing its year-to-date performance to -13.3%, while the Nasdaq also increased 4.7%, reducing year-to-date losses to 20.8%. EU equities are posting solid gains, and Asian stocks were broadly higher overnight. Longer-dated Treasury yields are flat after last week’s decline, with the 10-year yield holding at 2.65%, while the growth-sensitive yield curve remains deeply inverted, which is a classic recession signal. The broad dollar index is continuing to settle below mid-July’s multi-year peak, which was around its early pandemic high. Oil prices are turning lower ahead of this week’s OPEC+ meeting, with Brent crude sliding back toward $102 per barrel. – MPP upgrades US equities / downgrades the dollar: Our base case for topping inflation and slowing (but not crashing) growth with a downshifting Fed is the recipe for a second half 2022 tradable risk asset rally. With this past week’s developments increasingly aligning with this view, **we are upgrading stocks from neutral to 70% overweight and downgrading the dollar to a tactical sell, though we are still neutral on the Treasury market and curve. ** We still believe that summer markets will be choppy, and we just had a very positive week and a meaningful July rally, hence we are leaving some headroom to go further overweight if upside catalysts, like peaking CPI figures, materialize between now and the September FOMC decision. If this is an ordinary market cycle, then we would probably also assume that the bottom of this bear market is nearly in place. Our longer-term outlook, however, centers on the view that a second half 2022 relief rally will run into challenging realities in 2023, as the Fed is unable to cut rates in the face of persistently elevated energy prices and fears of backsliding in their inflation fight.
Fed Communications Downplay a Policy Downshift
After last week’s jumbo rate hike by the FOMC was balanced by signs of increasing sensitivity to slowing growth and hints of a potential deceleration in the pace of rate hikes over the coming meetings, Minneapolis Fed President Kashkari struck a hawkish posture in his Sunday interview. On CBS’s Face the Nation yesterday, Kashkari reiterated that the Fed is “committed to bringing inflation down” and that they are “a long way away from achieving and economy that is back at 2% inflation.” This comes after Fed Chair Powell’s post-meeting press conference was taken by market participants as opening the door to a slower pace of hikes, after the Committee upped the policy rate by 150 basis points (bps) over the past two meetings. Though Powell indicated that another 75bps is certainly on the table for the September 21 decision, the data between now and that meeting would provide direction. Kashkari, like Powell, downplayed the characterization of the US economy in recession but acknowledged that suppressing inflation may come at the price of growth contraction. Futures markets are now pricing in an additional 100bps of tightening through year end, with 50bps seen as the most likely outcome in September and two more 25bps hikes in November and December, respectively, but that being the top of the cycle, with rate cuts priced in by spring 2023. – MPP view: We understand that Fed officials want to rhetorically push back on building market optimism, as it works counter to their objective of tightening financial conditions. But we think that evidence will continue to build that an inflation peak will occur in the second half of the year, given all the signs pointing in that direction over the past couple of months. Fed rate hike assumptions had been contemplating 150bps over the July and September meetings and 3.75% by year-end, a level consistent with the terminal median rate in 2023 according to the FOMC projections (the dot plot) published at the June meeting, but we have anticipating that the Fed would move more gradually and futures markets have been shifting toward our view.
According to futures, the Fed is now seen being more likely to end the year at 3.50%, or below, with maybe 100bps of tightening over the next three meetings (Sept 21, Nov 2, Dec 14). We think there is still room for this to come down as easing growth and topping inflation allows for a more balanced FOMC policy posture.
Earnings Season Continues After Impressive Reports from IT Giants Last Week
The tone of second quarter (Q2) earnings season has turned increasingly positive and supportive of stocks after Amazon, Apple, and Microsoft all topped estimates last week, buoying equities to their best week since November 2020. Shares of Apple rose 5.5% last week after the tech giant’s Q2 figures, which it released after Thursday’s closing bell, topped revenue and earnings estimates. The key category of iPhone sales outperformed projections and CEO Tim Cook touted “our resilience and our optimism” in the face of a “cocktail of headwinds.” Amazon also issued impressive Q2 results on Thursday evening, handily topping revenue expectations, sending its share price 10.2% higher last week. The upbeat Q2 figures were accompanied by encouraging guidance for the coming quarter of as much as 17% revenue growth. Lastly, Microsoft posted similarly impressive sales for the quarter, which propelled its stock 7.8% higher last week. Big Oil also outperformed last week, with Exxon Mobil and Chevron shares soaring 11.4% and 13.6%, respectively, last week as the pair registered new record profits.
On the negative side, Facebook, Qualcomm and Intel saw their shares sink 6.0%, 5.6%, and 7.4%, respectively, after issuing disappointing results and sober guidance.
This week’s earnings calendar features less prominent companies but a heavy concentration of reports from diverse industries, with results from Aflac, Caterpillar, Cigna, ConocoPhillips, CVS Health, Electronic Arts, Eli Lily, Lyft, Marathon Petroleum, Marriott, MetLife, PayPal, Prudential, Starbucks, and Yum! Brands. Of the 280 S&P 500 companies that have reported thus far, 61% have topped sales expectations while 73% have beaten earnings projections, which are somewhat lower than recent levels though equity price reactions have tended to be positive if somewhat uneven. – MPP view: We had expected more mixed results from the tech majors but this week’s encouraging releases from Google, Amazon, Apple, and Microsoft have tipped the scales toward this being a supportive earnings season for stocks in the face of grim expectations.
Additional Themes
Downbeat Chinese Purchasing Managers’ Indexes (PMIs) – China’s official PMI composite metric slid from 54.1 to 53.5 in July, with the manufacturing gauge sliding into contraction at 49.0 versus expectations of a tepid but stable 50.3 after June’s 50.2. For context, PMIs above 50 denote expansion in the sector. The service PMI was better but also slightly missed expectations and declined from the prior month’s 54.7 to 53.8. The privately-compiled Caixin manufacturing PMI was modestly better at 50.4 but also undershot the consensus forecast of 51.5 and June’s 51.7. The renminbi slipped 0.2% versus the dollar overnight but remains rangebound around its weakest level since fall of 2020.
Uncertainty Over Speaker Pelosi’s Taiwan Trip – Taiwan equities lagged the region but registered only modest losses, while the Taiwan dollar dipped to its weakest level versus the dollar since May 2020 amid confusion over Speaker Pelosi’s upcoming Asia trip itinerary. Her trip schedule that was published last evening made no specific mention of Taiwan, but reports this morning citing US and Taiwanese officials indicate that she is expected to visit the island sometime this week. For context, the planned trip has been met with discomfort by the White House and furious opposition from Beijing. Chinese officials have suggested a possible military response to what they would consider a hostile act.
Latest Macrocast: Breaking Down the Fed’s Big Week with Howard Schneider – On today’s Macrocast, Tony, John, and Brendan welcome Howard Schneider, Federal Reserve reporter at Thomson Reuters, to the show. As an expert on all things Fed and monetary policy, Howard breaks down the Fed’s latest rate hike and inflation’s impact on food consumption. Plus, the group analyzes the concerning PCE and GDP data released this week. Tune in here! https://marketspolicy.com/podcast-2/
Read Howard Schneider’s recent piece on food prices and rising hunger here.
Find more of Howard’s work here.
Read HPS’ Q2 GDP Fact Sheet here.
Macrocast Special: A Conversation with Megan Greene on the Anti-Inflation Toolkit – In this special edition of the Macrocast, Tony and John welcome Megan Greene, Harvard Kennedy School Senior Fellow and Kroll Institute Global Chief Economist, to the show. Megan expands on her recent column in the Financial Times, where she makes an important point few pundits have acknowledged: There’s not much policymakers outside the Federal Reserve can do about inflation. The group walks through various policy responses to inflation and the supply- and demand-driven forces behind rising prices. Plus, the group discusses energy prices, the methodology for measuring inflation, and more. Tune in here! https://marketspolicy.com/podcast-2/
Read Megan’s Financial Times column here.
Read the rest of Megan’s FT columns here.
Read Megan’s bio and check out her site here.
Looking Ahead – This week’s macro calendar features the US nonfarm payroll figures for July, which is expected to reflect continued resilience in the US labor market with 250k jobs and steady unemployment at 3.6%. Other notable data includes global Purchasing Managers’ Indexes (PMIs), EU and Australian retail sales, German factory orders and industrial production, and Turkish inflation figures. The Bank of England and Reserve Bank of Australia have decisions. OPEC+ conducts its monthly meeting on supply curbs and earnings reporting season continues with an array of industry bellwethers reporting (see above).
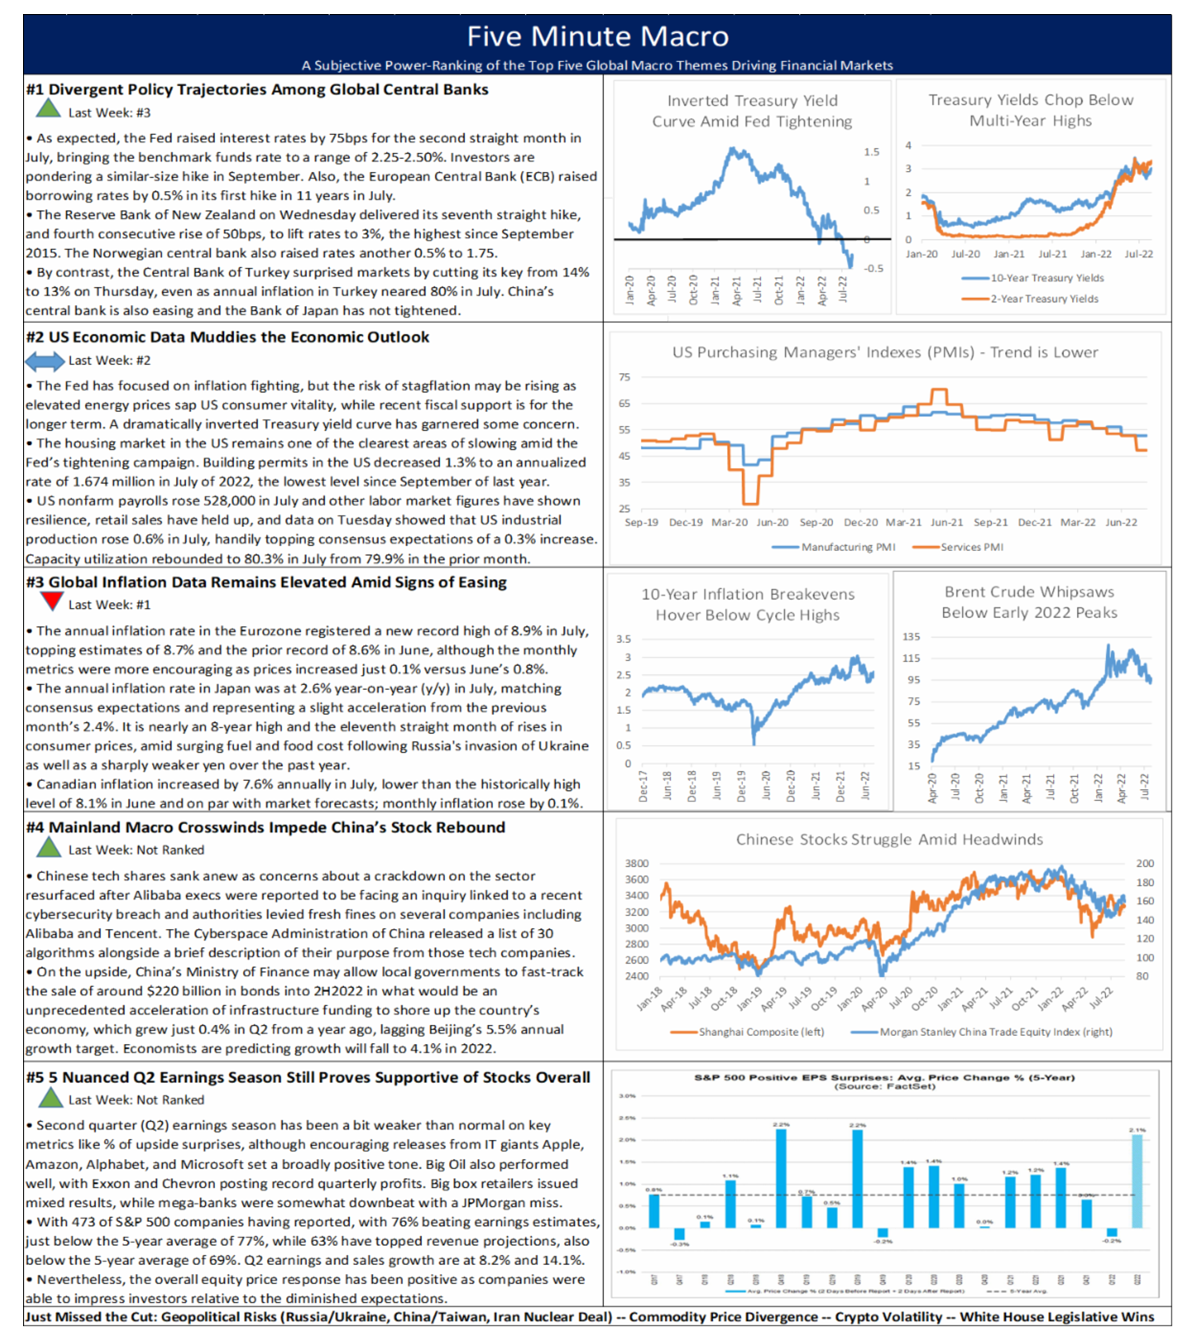
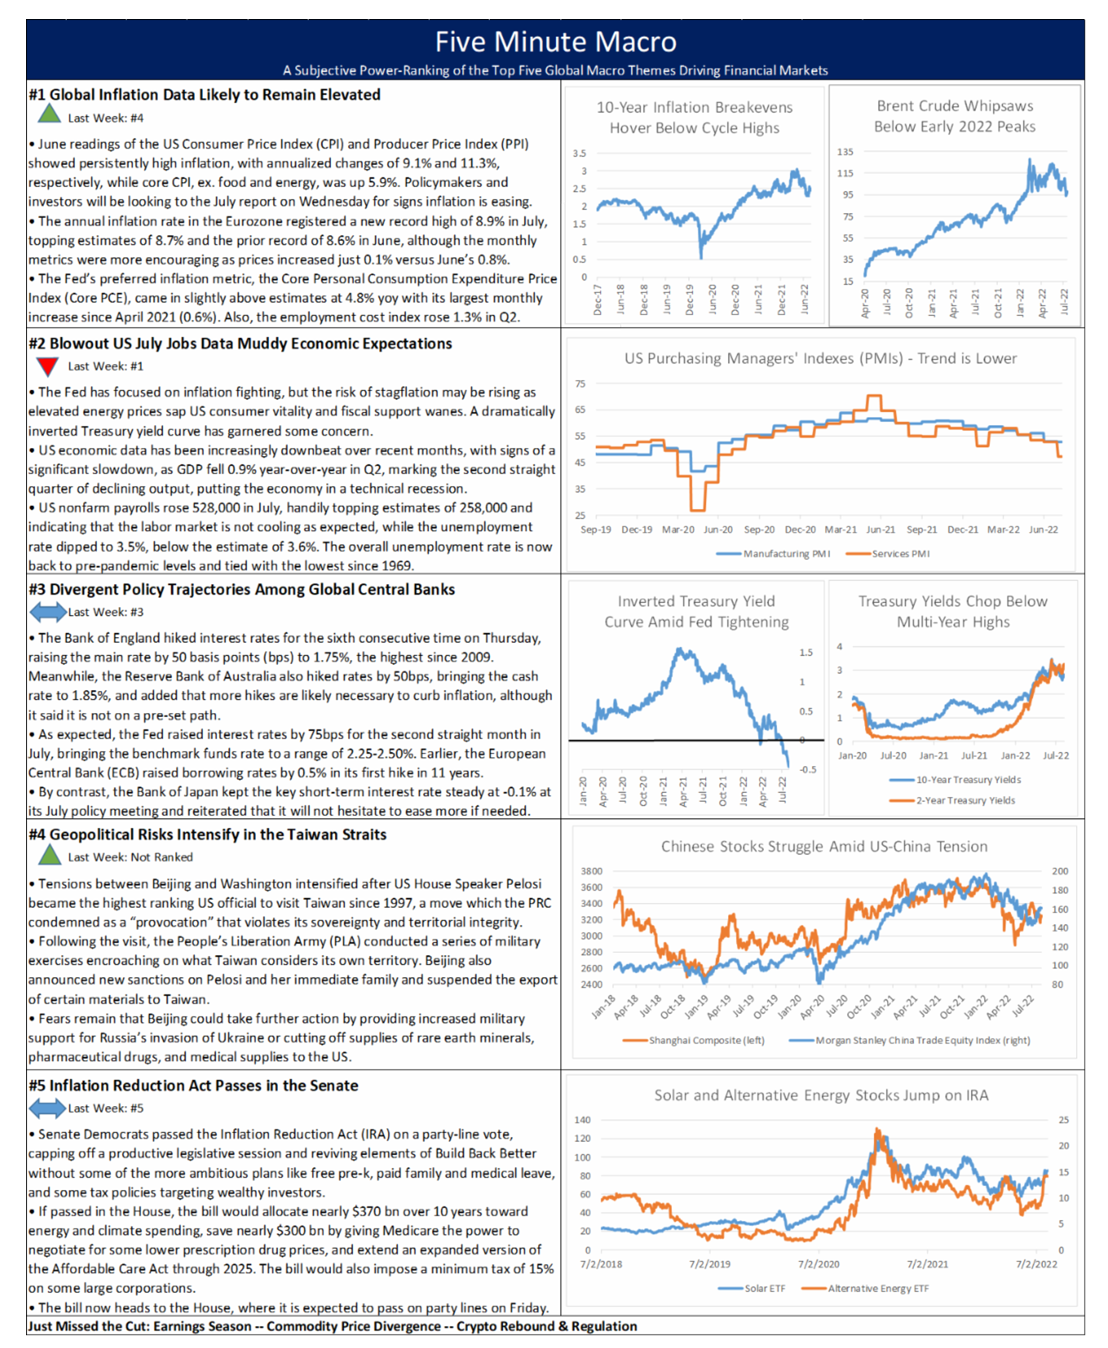
Elevated inflation levels remain the front and center following last week’s blowout jobs report. Currency markets continue to move on divergent central bank policies and geopolitical risks intensify around Taiwan. Finally, the Senate passed the Inflation Reduction Act and sent it to the House for passage this week.
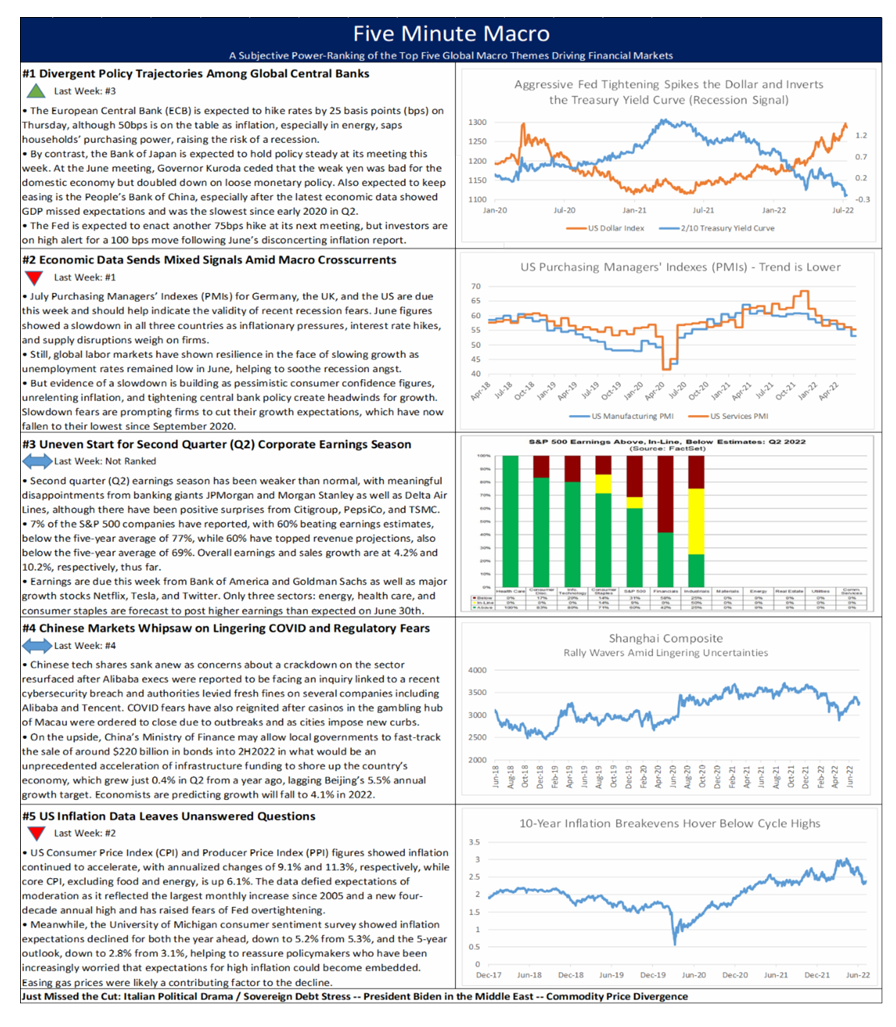
Divergent central bank policy continues to drive markets in the face of slowing global growth and mixed second quarter corporate earnings. This week brings global inflation data and Italian political drama.
Divergent central bank policy moves into the top stop this week while mixed macro data moves down a spot. Corporate earnings continue along with Chinese Covid fears and last week’s inflation data leaves unanswered questions.
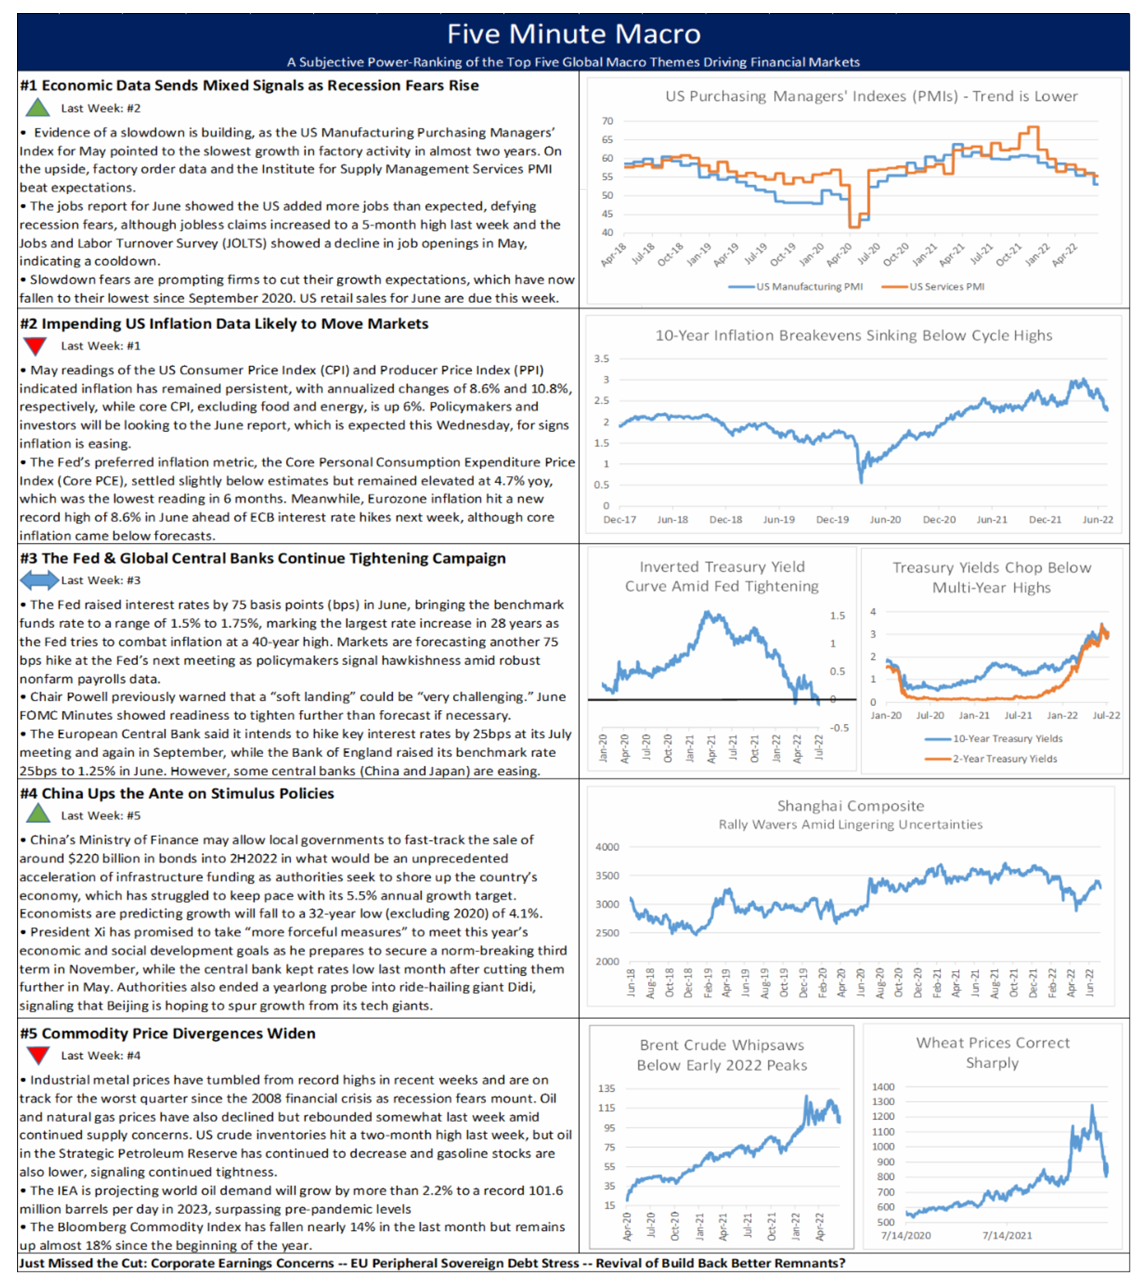
Economic data continues to send mixed messages as we await tomorrow’s CPI data. Central banks continue their tightening campaigns while China ramps up stimulus measures. Finally, commodity prices continue to fall.
| Looking Ahead – Halftime Huddle
“Worst first half of a year since 1970 for US stocks” is the headline grabber stat from Q1-2 2022, as investors and analysts alike grapple with what is shaping up to be a punishing conclusion to the ultra-accommodative monetary policy era in the face of multi-decade highs in inflation with scant relief in sight. Our view is that this is still going to be a year of two halves, as slowing growth and meaningful recession risk, alongside signs of a developing downtrend in price pressure metrics, facilitate a downshift in the Fed’s pace of monetary tightening.
For now, though, we are sitting tight with the neutral positioning in equities, rates, and currencies we adopted in mid-May as we wait for this sloppy/choppy early summer transition period to pass ahead of some clearing for the second half of this year.
Supporting our call for a more balanced macro picture in the second half of the year are the declines in US gasoline prices, global metals prices, the CRB Raw Industrials basket, used car prices, freight and shipping rates, etc. which we think in aggregate track a broad rollover in price pressures (please see last week’s Looking Ahead – Summer Squalls for a set of these charts). TIPS breakevens, the key market-based gauge of inflation expectations, are tracking this narrative.
Even if inflation is in the process of moderating, however, this is not yet clear from the data, which has been like a Rorschach Test. Core PCE Prices were relatively encouraging but the Consumer Price Index (CPI) and Producer Price Index (PPI) were the opposite of reassuring, while increasing evidence of slowing growth in PMIs and Fed activity surveys, alongside dismal business and consumer confidence surveys, is being balanced to some degree but still robust labor market indicators. And without a clear trend, the headline risk associated with each discrete US inflation data release is so high that building long positions in anticipation of a better 2H2022 is still quite problematic – as was shown by the steep losses that followed the dispiriting upside surprise in May CPI, which may end up being an outlier in an overall deceleration.
We expect that trends will be clearer by the July meeting, where a 50 basis point (bps) hike, which is our base case, would look like a dovish surprise. If this is accompanied by more measured Fed rhetoric on inflation fighting and a more balanced stance, anticipation of similar restraint in September and beyond should help stabilize global risk assets after the drubbing they took in the first half.
What would change our minds? Top 5 1. US inflation and growth fail to slow in tandem into the second half of the year 2. Growth and inflation pressures do wane, but the Fed declines to downshift their tightening trajectory despite growing evidence of a slowdown and narrowing inflationary pressures, driving the economy into the ground (this is currently the base case reflected in financial markets) 3. Oil prices break higher out of their current trading range and march to record highs, all but ensuring global stagflation irrespective of central bank policy adjustments 4. Growth and inflation moderates, the Fed downshifts its pace of tightening, but the damage is already done to the economy and activity contracts much faster than expected before the Fed is able to contemplate cuts 5. Black swan event – candidates include EU debt crisis redux, the disorderly implosion of Tether, the collapse of the Bank of Japan’s Yield Curve Control policy, failure of a major hedge fund, and a significant escalation in the Russia/Ukraine or other global flashpoint.
What is likely to follow a 2H2022 rebound? Coaches will always tell their teams not to look out to the next game, and while that’s sound advice for athletes, investors don’t have that luxury. Futures markets are pricing in Fed rate cuts in 2023, which is at odds with our base case, as it would take a sharply disinflationary episode (recession) to induce the Fed to take such a step even in the face of what is still expected to be above 2% target inflation. In short, we think markets are likely to get better for a time before likely relapsing in 2023 whereas the market seems to be suggesting more near-term pain followed by an easing of conditions in 2023. |
|
|
|
|
||
| Looking ahead, next week’s holiday-shortened macro calendar in the US features the nonfarm payroll report for June, which is expected to remain robust despite percolating fears of an impending recession, while the June Fed and ECB Meeting Minutes will also be in the spotlight. The Reserve Bank of Australia has a decision, and G-20 foreign ministers are meeting in Bali, Indonesia. Other notable data includes additional global PMI readings and EU retail sales, industrial production, and wholesale prices.
· US Nonfarm Payrolls · Fed Meeting Minutes · ECB Meeting Minutes · Global PMIs · EU Retail Sales · EU Industrial Production · EU Wholesale Prices · Australia Central Bank MPP Holiday Publication Schedule – There will be no Market Viewpoints or Five Minute Macro on Sunday and Monday, respectively, due to the holiday weekend in the US – normal publications will resume on Tuesday. Here’s wishing all our US subscribers a very happy 4th of July weekend! |
|
||
| Global Economic Calendar: Summer jobs
Monday
The German trade surplus fell sharply to €1.3 billion in April from €9.7 in the previous month, marking its lowest level since 1992 as imports jumped 25.2% year-on-year to €120.9 billion compared to a much smaller 9.2% increase in exports to €122.2 billion. On a seasonally adjusted basis, German exports rose 4.4% compared with March as shipments to the EU and US rose 4.2% and 7.7%, respectively, although exports to Russia fell another 10% after falling 62.3% in March due to sanctions imposed. Meanwhile, imports increased 3.1% from the previous month boosted by purchases from China (up 12.3% from March) the UK (up 5.6%), and the Eurozone (2.4%), while imports fell from the US (-1.2%) and Russia (-16.4%).
The annual inflation rate in Turkey increased for the 12th consecutive month to 73.5% in May, the highest since October 1998 and up from 69.97% in April and a much lower 16.6% in May 2021. Figures came below market forecasts of 76.6% but remained extremely elevated as the lira continued its plummet and as real interest rates remained largely negative. Upward price pressures were recorded across sectors, including food and non-alcoholic beverages (91.6% vs 89.1% in April); housing and utilities (63.5% vs 61.1%); furnishings and household equipment (82.1% vs 77.6%); hotels, cafes, and restaurants (76.8% vs 69.3%); and transportation (107.6% vs 105.9%), which was fueled by surging prices for energy (121.1% vs 118.2%). On a monthly basis, prices rose 3% from April.
The Caixin China Manufacturing PMI increased to 48.1 in May from April’s 26-month low of 46.0, marginally beating market forecasts of 48.0 but marking the third straight month of declining factory activity amid continued COVID-zero restrictions. Both output and new orders fell amid further declines in export orders and employment – albeit at a softer pace than the previous month. Meanwhile, backlogs of work and delivery times continued to increase due to COVID-related disruptions and travel curbs, prompting firms to cut purchases in order to cut down on inventory. Looking forward, business sentiment fell for the fifth consecutive month as managers remained wary of the continued impact of COVID restrictions and the war in Ukraine.
Tuesday
The Reserve Bank of Australia increased interest rates by 50 bps at its policy meeting in June in its first back-to-back rate hike in 12 years, bringing the cash rate up to 0.85% as the board said its prior position of huge monetary support is no longer appropriate given the strength of the economy and elevated inflationary pressures. The central bank also said labor markets have remained strong as employment numbers continued to make gains and the jobless rate fell to its lowest in nearly 50 years. “The Board expects to take further steps in the process of normalizing monetary conditions in Australia over the months ahead,” RBA Governor Philip Lowe said in a statement.
US factory orders rose 0.2% month-over-month to $533.2 billion in April following a downwardly revised 1.8% gain in March, falling short of market expectations of a 0.7% gain. Orders slowed for durable goods (0.5% vs 0.7% in March), namely for primary metals (0.8% vs 3.3%) and computers and electronic products (0.1% vs 1.8%), while those for fabricated metal products (-0.1% vs 1.2%) and electrical equipment, appliances, and components (-0.2% vs 2.6%) declined. Still, orders accelerated for machinery (1% vs 0.6%) and transport equipment (0.7% vs -0.3%). Among nondurable goods, orders slowed to 0.2% from 0.9% in the previous month.
Wednesday
The ISM Manufacturing PMI for the US unexpectedly rose to 56.1 in May from 55.4 in April, beating market forecasts of 54.5 as new orders (55.1 vs 53.5 in April), production (54.2 vs 53.6), and inventories (55.9 vs 51.6) all posted faster increases. In addition, price pressures decreased for the second consecutive month, falling to 82.2 from 84.6. Meanwhile, employment contracted to 49.6 from 50.9, although firms reported improved progress on addressing moderate-term labor shortages at all levels of the supply chain. Business sentiment remained robust regarding demand, although managers reported continued concern over supply chains and pricing issues.
The Jobs and Labor Turnover Survey (JOLTS) showed the number of job openings in the United States was 11.400 million in April, down from a revised record 11.855 million in March. Figures came in line with market expectations. Job openings decreased in several industries, with the largest declines in healthcare and social assistance (-266,000), retail trade (-162,000), and accommodation and food services (-113,000). Job openings increased in transportation, warehousing, and utilities (+97,000); nondurable goods manufacturing (+67,000); and durable goods manufacturing (+53,000). Meanwhile, the so-called quits rate was unchanged at 2.9% as some 4.4 million Americans quit their jobs.
Minutes of June’s FOMC Meeting will provide more clarity on the Fed’s decision to hike interest rates by 75 bps. Chair Powell said at a European Central Bank conference that the US economy is in “strong shape,” and the central bank can reduce inflation to its target of 2% while maintaining a solid labor market. “We will not allow a transition from a low inflation environment to a high inflation environment,” he said. Nonetheless, policymakers are cautious of acting too aggressively. In testimony to the Senate banking committee last Wednesday, Powell acknowledged that steep interest rate hikes may cause a recession and that avoiding it mostly depends on factors outside of the Fed’s control. “The other risk, though, is that we would not manage to restore price stability and that we would allow this high inflation to get entrenched in the economy,” Powell added. “We can’t fail on that task. We have to get back to 2% inflation.”
Australia’s trade surplus widened to AUD 10.50 billion in April from an upwardly revised AUD 9.74 billion in March, beating market forecasts of a AUD 9.3 billion surplus. It was the largest trade surplus since January, as exports grew by 1% from a month earlier to a new record high of AUD 50.38 billion, while imports dropped 0.7% to AUD 39.88 billion. For the first four months of the year, the trade surplus increased to AUD 40.80 billion from AUD 34.48 billion in the same period last year.
Thursday
Canada’s trade surplus narrowed to CAD 1.5 billion in April from a downwardly revised CAD 2.3 billion in the previous month, falling well short of market expectations of CAD 2.9 billion as imports rose by 1.9% to a record high of CAD 62.8 billion compared to a slower 0.6% rise in exports to CAD 64.3 billion, also a record high. The rise in imports was fueled by increased purchases of clothing, footwear, and accessories (24.2%); metal and non-metallic mineral products (10.5%); and energy products (5%), with natural gas and refined petroleum product purchases rising 57% and 52.6%, respectively, to offset a 20.9% reduction in crude oil imports. On the export side, shipments were lifted by sales of consumer goods (5%) and motor vehicles and parts (3.9%), although energy exports fell 0.9%.
The Ivey Purchasing Managers Index in Canada rose to 72 in May from 66.3 in the previous month as employment climbed to its highest level in 11 months (67.9 vs 65.1 in April), inventories rose (69.8 vs 64.1), and price pressures edged down (82.4 vs 90.2). Supplier delivery times, however, continued to lengthen (42.3 vs 37.8).
Friday
Canada’s unemployment rate fell to 5.1% in May from 5.2% in April, the lowest rate since comparable data became available in 1976 and marginally below market forecasts of a sustained 5.2%. The rate in four provinces – British Columbia (4.5%), New Brunswick (7.1%), Prince Edward Island (7.8%), and Newfoundland and Labrador (10.0%) – was similar or below previous all-time lows, and employment gains were especially pronounced among young and core-aged women and in Alberta.
The US unemployment rate was unchanged at 3.6% in May, remaining at its lowest level since February 2020 for the third consecutive month but slightly above market expectations of 3.5%. The number of unemployed people increased by 9 thousand to 5.950 million, while employment levels rose by 321 thousand to 158.426 million. The labor force participation increased to 62.3%, up from April’s three-month low of 62.2%. Meanwhile, the Nonfarm Payroll Report showed the US economy added 390K payrolls in May, the least since April 2021 but above market forecasts of 325K. Payrolls increased across several sectors, including leisure and hospitality (84K), namely food services and drinking places (46K) and accommodation (21K); professional and business services (75K); transportation and warehousing (47K), namely warehousing and storage (18K), truck transportation (13K), and air transportation (6K); and manufacturing (18K). In contrast, payrolls fell in retail trade (-61K), mainly due to job losses in general merchandise stores (-33K).
Russia’s annual inflation rate eased to 17.1% in May from April’s 20-year high of 17.8% and below market estimates of 17.3%. On a monthly basis, consumer prices increased 0.1% after rising 1.6% in April, with price inflation slowing for food (0.6% vs 2.9% in April) and reversing for non-food (-0.1% vs 0.5%), and services (-0.3% vs 1.1%).
China’s annual inflation rate remained at April’s five-month high of 2.1% in May, below market forecasts of 2.2%. Food prices increased the most since September 2020, up for the second straight month (2.3% vs 1.9%) in April, as consumer activity picked up amid easing COVID restrictions in many major cities. Non-food inflation fell slightly (2.1% vs 2.2%) as price pressures cooled in housing (1.0% vs 1.2%), transportation & communication (6.2% vs 6.5%), and culture (1.8% vs 2.0%), although inflation in clothing (0.6% vs 0.5%), household goods and services (1.4% vs 1.2%), and healthcare (0.7% vs 0.7%) costs remained at or above April’s figures. China set a target of CPI at around 3% for this year, the same as in 2021. On a monthly basis, consumer prices fell 0.2% in May, the first monthly decline in five months, compared with consensus of a 0.3% drop and after a 0.4% rise in February. |
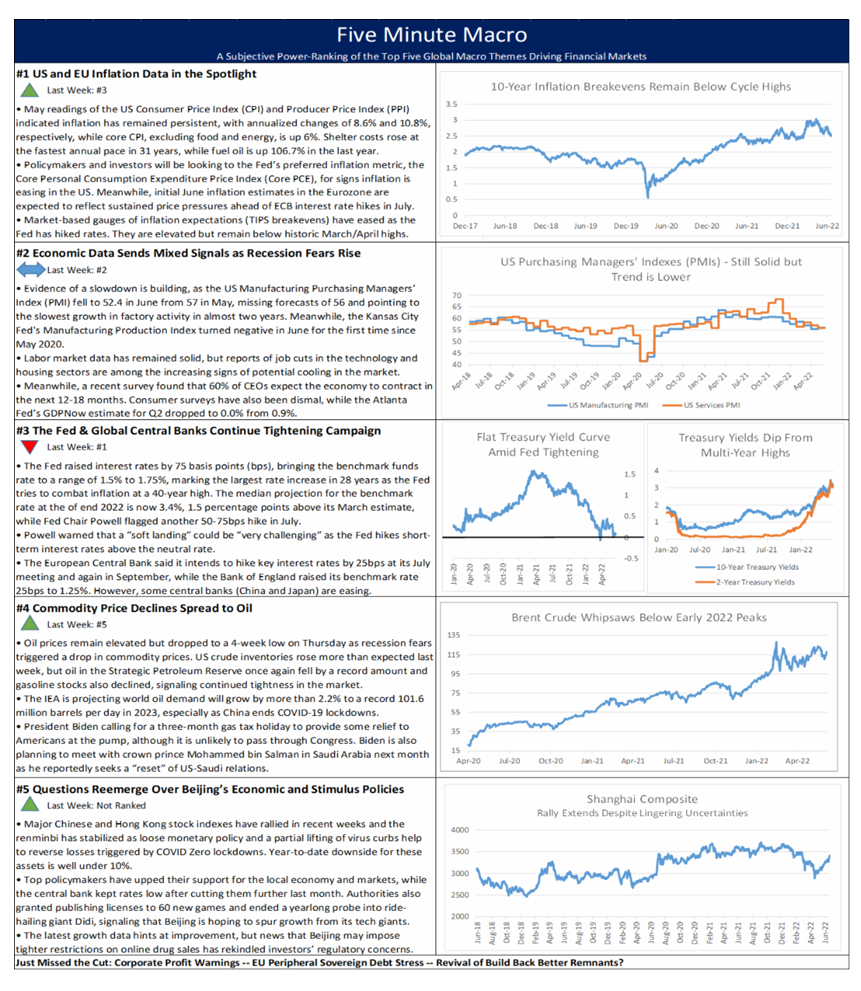
US and EU inflation data remains in the spotlight and economic data sends mixed messages on the recession front. The Fed and other central banks continue their tightening campaigns which has seen commodity prices fall and finally, questions of China’s stimulus reemerge.